Linear Programming Module
of NutriSurvey
Linear programming is a mathematical tool which can give clear answers
to very practical questions faced in the field by nutritionists working
in developing countries:
• Is it possible with locally available food to provide
all nutrients needed by a young child ?
• What quantity of nutrient rich foods are needed to
provide all micronutrients ?
• If this is possible, how much will it cost ?
• What food combination is best adapted to provide
all needed nutrients at the lowest cost ?
• Are micronutrient supplements or fortified foods
useful to feed a child a balanced diet at low cost ?
Linear programming is based on the examination of multiple inequalities a
the same time. The mathematical principles of this method and its applications
to human nutrition have been described elsewhere (see links at the end of
this page).
The Linear Programming Module of NutriSurvey is a user-friendly software
which allows this type of analysis.
To install the software, please download the following file lp.zip and unzip it in an empty directory. You can start
the program by clicking in the chosen directory on the file 'nutrisurvey.exe'.
You get the following screen:
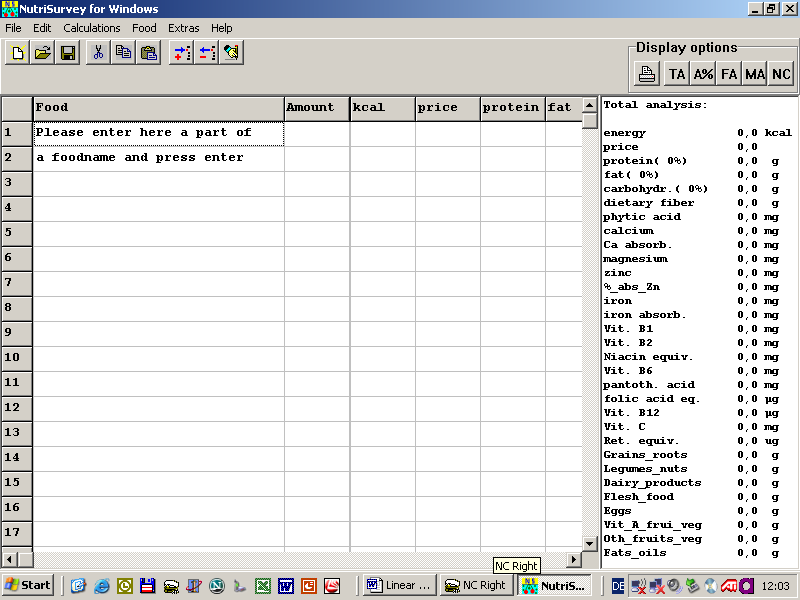
Now you should make a list of all foods locally available that can be
used in the diet you are designing. Foods are selected by typing a few letters
of their name and then by typing enter. You get a list of all foods containing
these letters and you have to choose one of them by moving the cursor.
For instance, if you type "rice boiled", you get the following screen:
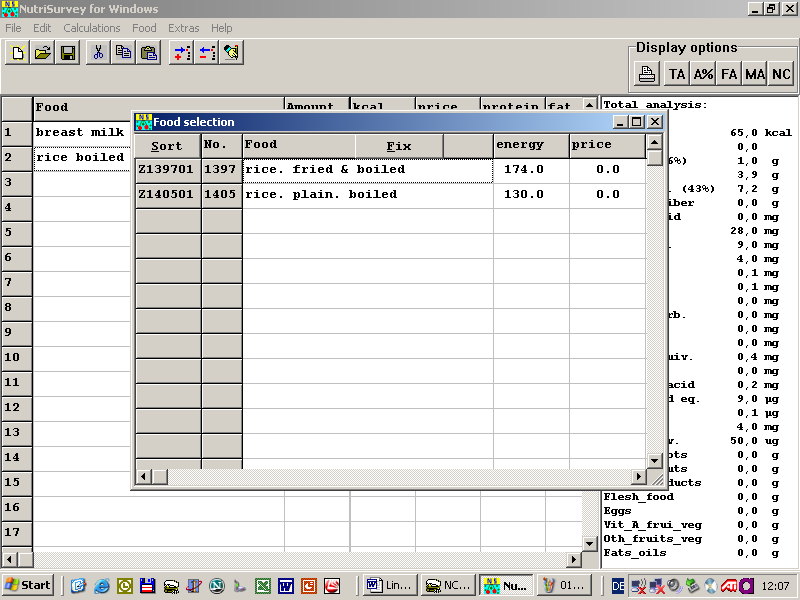
The cursor in this example has been moved to "rice plain boiled" that
will be selected when you press enter. This window gives you the nutritional
composition for 100g which may be useful to check if it corresponds to
the value of the local food.
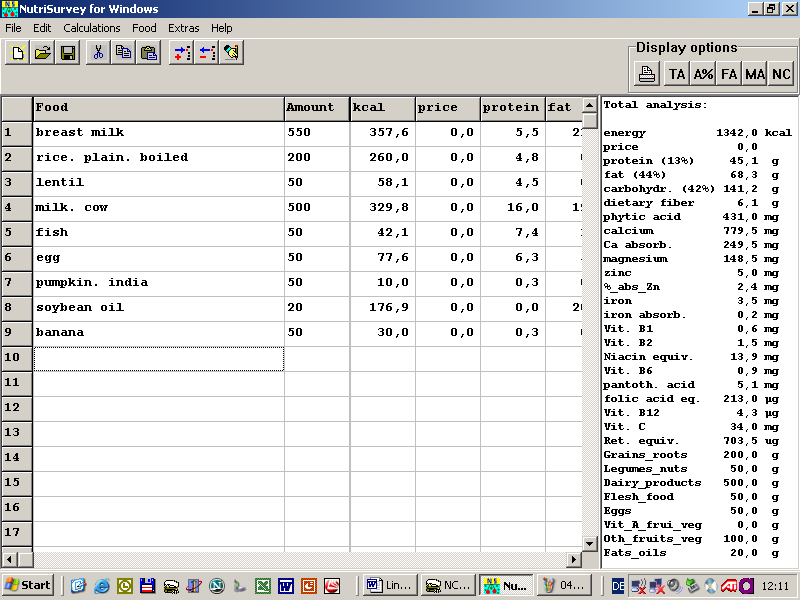
Once you pressed "enter", you get the screen:
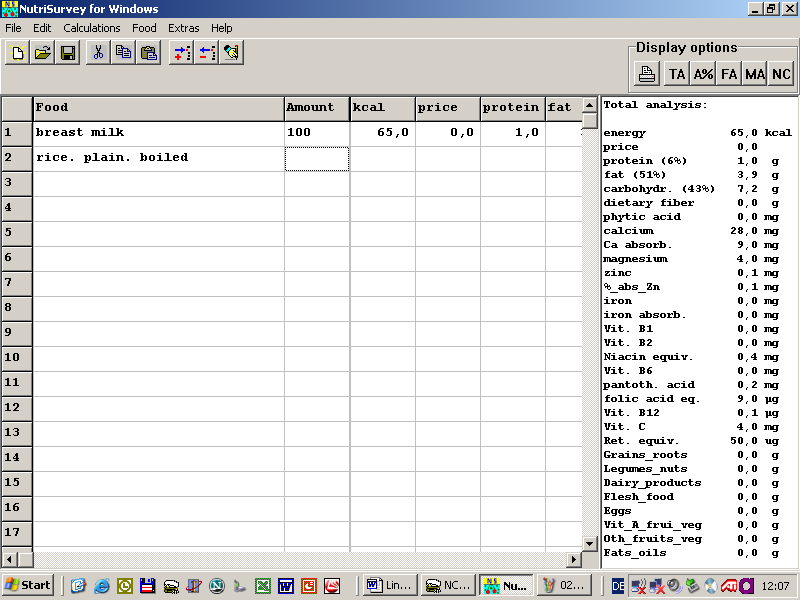
The cursor is now on the Amount column. At this stage, you can enter
100 g arbitrarily, or you can put an amount of food which is in the usual
range consumed by children in this age group. If you enter 100g, you end
up with a food composition table adapted to your local situation on your
screen.
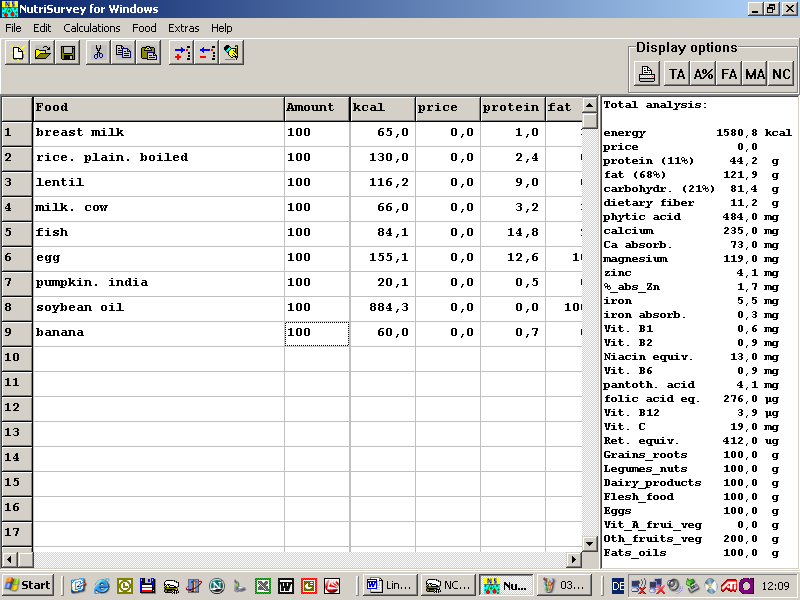
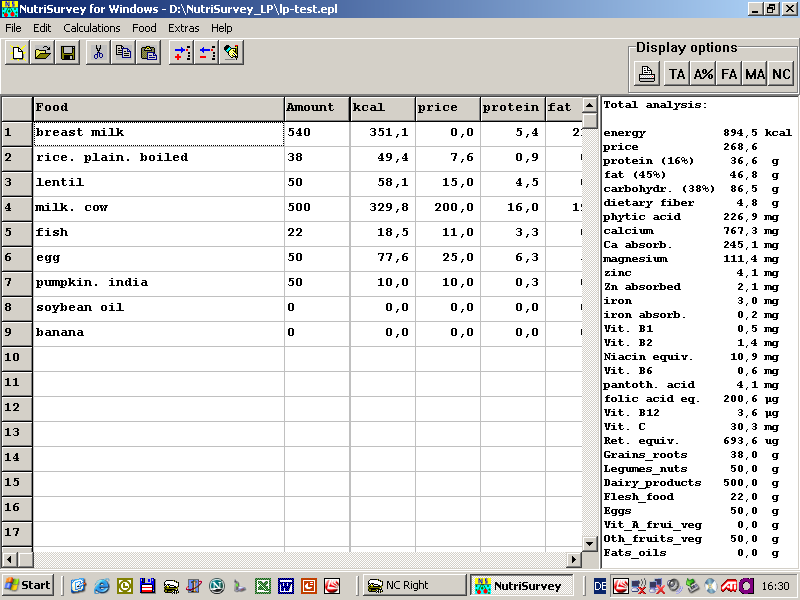
If you enter amounts of foods that are in the usual range of intake,
you get an analysis of the nutritional composition of the diet you just
designed displayed on the right side of the screen.
Now, to get an optimized diet, select the function "Linear programming
of the food plan" on the "Calculation" menu. After being asked if you want
to save your file, you get the following screen:
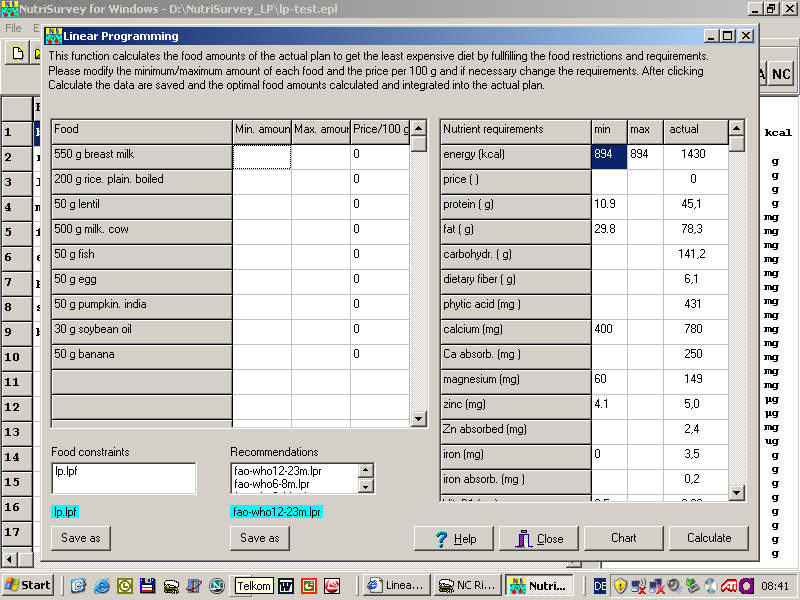
At this stage, select the set on nutritional recommendations you want
to use from the recommendation window. In this example, we selected the file
fao-who12-23m.lpr which corresponds to the FAO/WHO recommendations (2002)
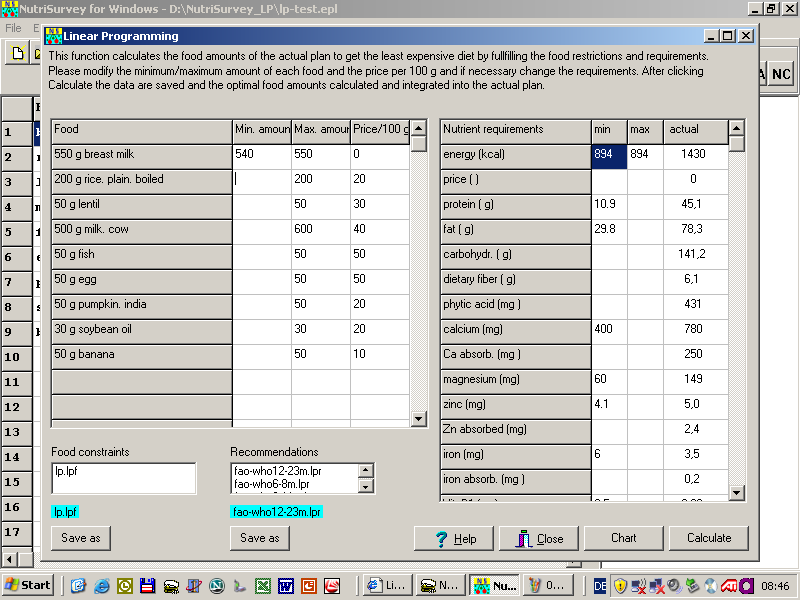
for children aged 12-23 months. Then write for each food an upper
acceptable limit in the Max amount column. Lower limits can be entered for
some foods if needed in the Min amount column. In this example, breast milk
intake was set between 540 and 550 ml and only upper limits were set for
other foods. This upper limit should correspond to the maximum amount of
each food that can be reasonably recommended on a daily average to children
of this age. For example, if you think a child can reasonably eat 35 g
of liver per week, you type the average per day, i.e. 5 g. Also, the price
of 100 g each food in the local currency should be entered in the same window.
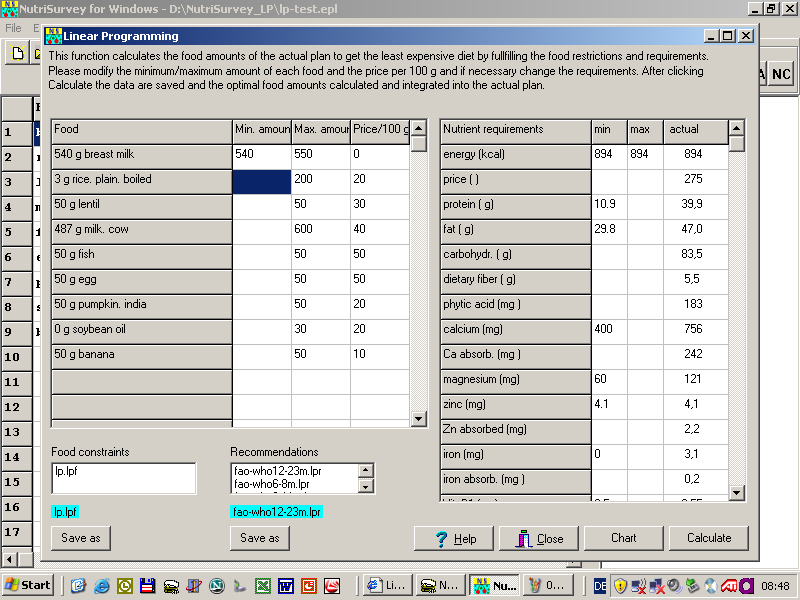
The following screen is obtained:
To examine whether designing a diet fulfilling all nutritional recommendations
is possible with this food basket, click on "Calculate". You get the following
screen:
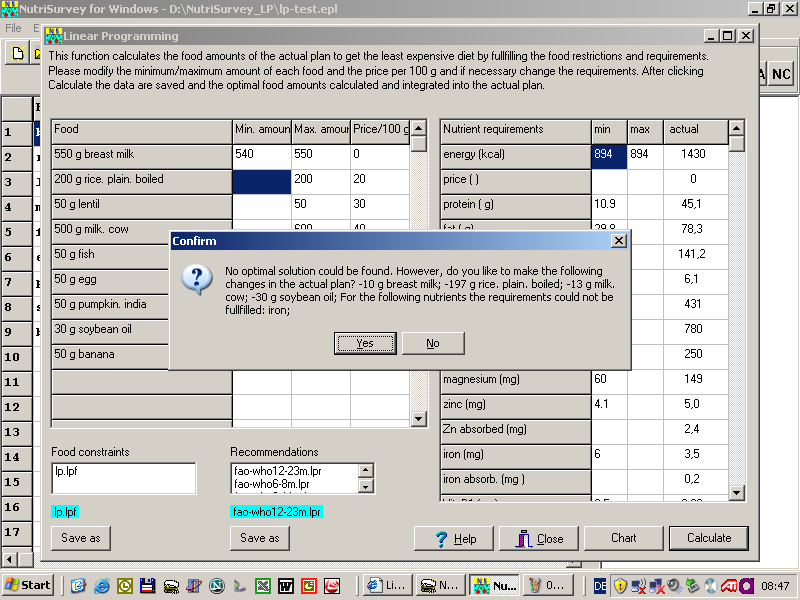
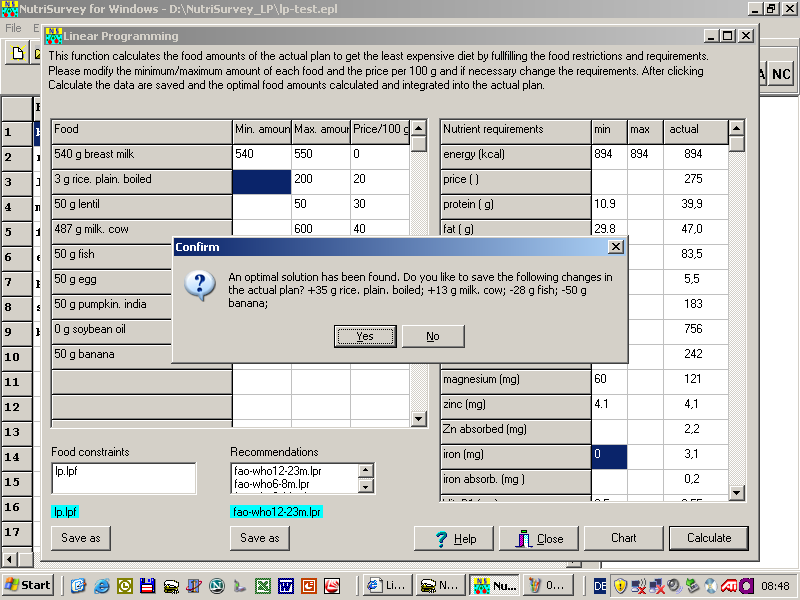
The analysis showed that it is impossible in this example to provide
all the required iron with the proposed food basket. The program tells
us that there is not enough iron. Now let's assume that you decide to rely
on home based fortification (with the use of sprinkles or dispersible tablets)
to provide the needed iron that you cannot provide by dietary means. In
that case, you set the minimum amount iron to 0 in the nutrient requirement
window. If you change the nutrient constraints (corresponding to nutrient
requirements), save them with a different file name. In this case, you will
be able to recover the original constraints.You get the following screen:
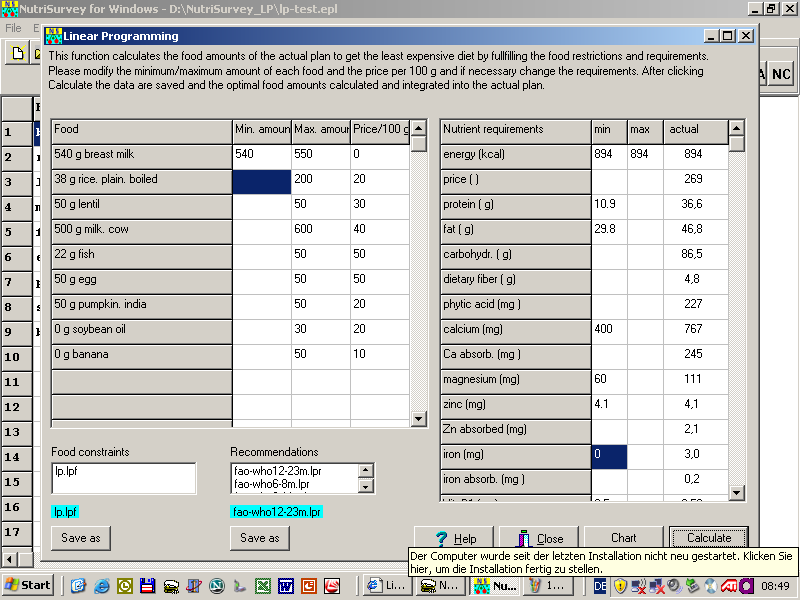
By repeating the calculation, you see that with this new set of nutritional
constraints, it is possible to obtain a diet fulfilling all nutritional
recommendations.
If you accept the solution proposed by the program, you see the food
composition of the optimized food basket, in the food column of the next
screen:
If you click on the chart option, you get a graph showing which nutrients
are limiting in this diet (Zinc, Vit. B1 and Vit. C in this example).
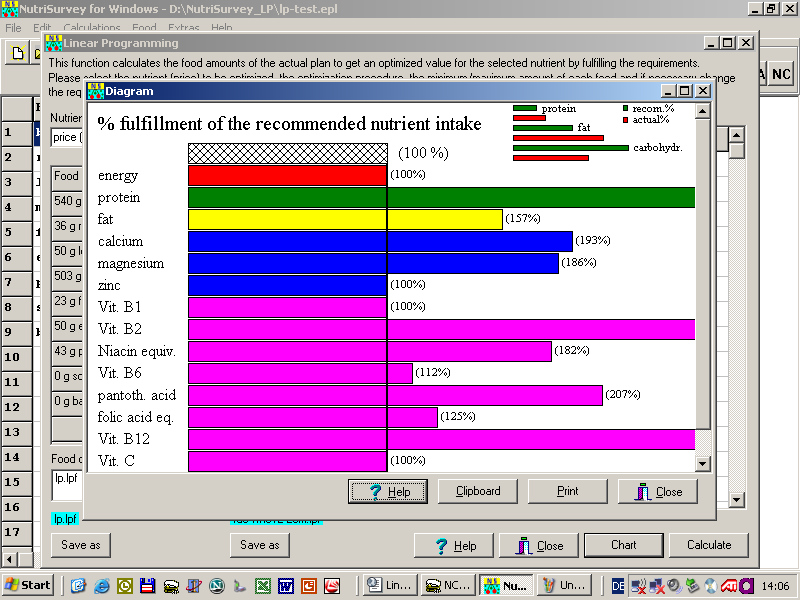
If you click on the "Clipboard" button, you can paste the graph in a
word processor file for report writing. After closing the linear programming
function, the results are transferred to the main window of NutriSurvey.
On this screen, you have the details of the optimized diet, with the
contribution of each food for each nutrient.
You optimised the diet by linear programming !!!.
Some more background information can be found in the following file and in two PDF articles (Food and Nutrition Bulletin, SCN-News). If you have any additional question please
don’t hesitate to contact us:
André Briend, MD, PhD
Medical Officer
Department of Child & Adolescence Health and Development
World Health Organization, Genèva, Switzerland
brienda@who.int
Juergen Erhardt, PhD
SEAMEO-TROPMED, University of Indonesia
Jakarta, Indonesia
mail@nutrisurvey.de