The Food Securiy module of ENA for SMART allows the analysis of the food security of households in a certain area, especially the likely impact of a shock (e.g. reduction in food production caused by drought). It is based on the Household Economy Approach which enables to see quantitativley which households are most affected and thereby allowing to design better interventions and to target them to the most vulnerable. It is therefore complimentary to the other parts of ENA (Anthropometry and Mortality) and a possibility to explain why the nutritional status is bad or the mortality high and how this will probably develop in the future.
To see on how this works please click on this demofilm. It will take less than 5 minutes to show the principles of this function. The version of ENA which contains this function is still in development for the new version II (www.nutrisurvey.net/ena_delta) and should therefore only be used for the Food Security part. For more details please open the manual for this part of SMART. It contains all the information which is necessary to do a food security assessment.
The following pictures give a short insight on how this function of ENA looks like:
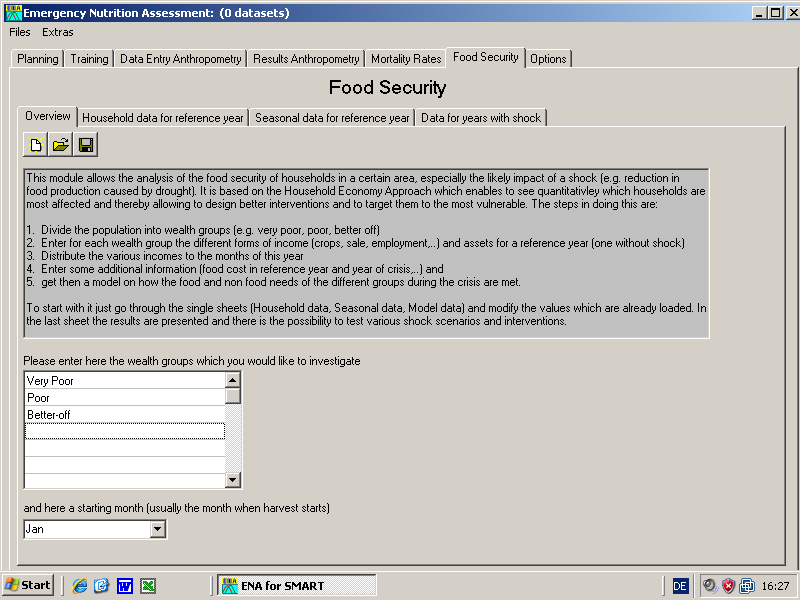
This is the first sheet where besides some general information the wealth groups are defined
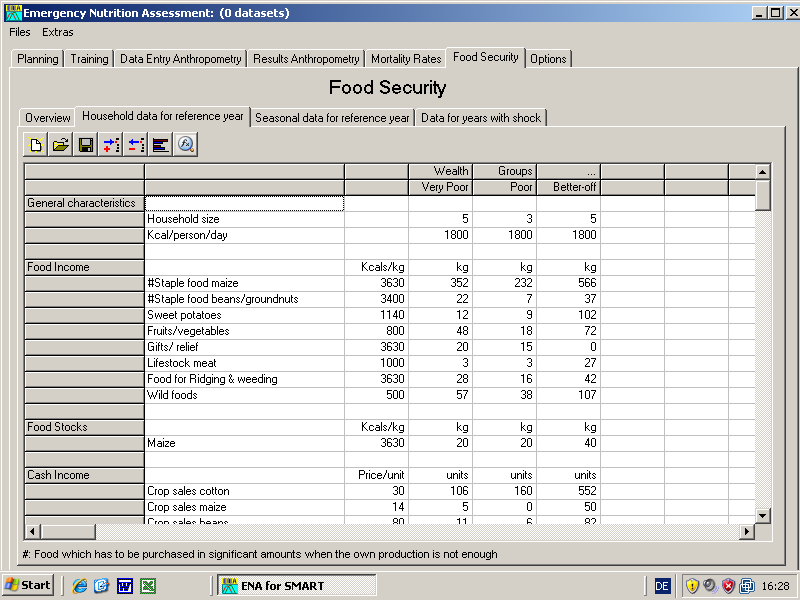
In the second sheet for each wealth group the different forms of income (crops, sale, employment,..) and assets for a reference year (one without shock) can be entered. It should reflect the whole household economy and gives already some valuable information on how much food is self produced and how much has to be bought.
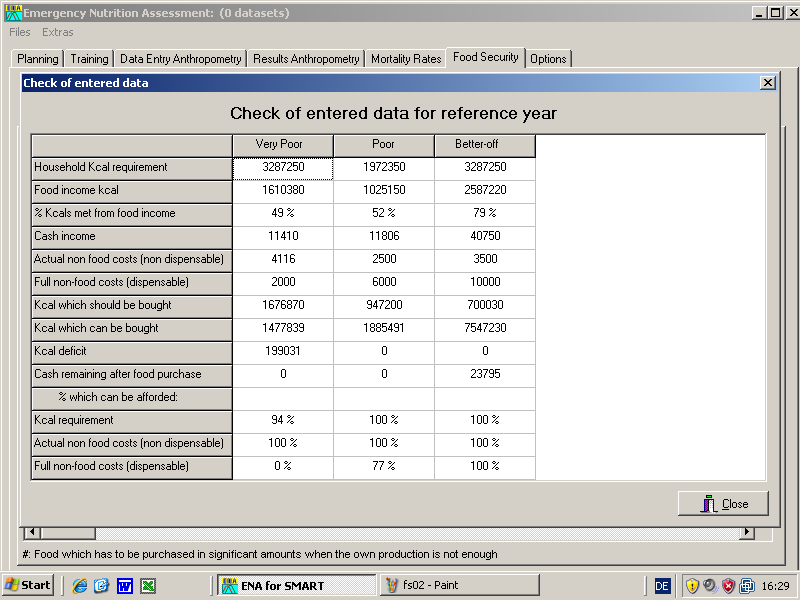
One of the functions in this sheet is to check the entered data for plausibility.
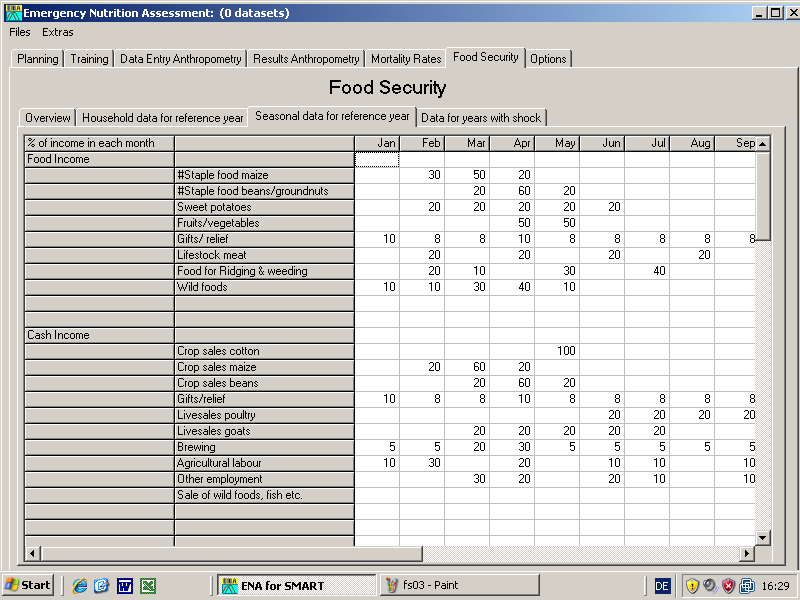
The next sheet is for the distribution of the various incomes to the months of the reference year to see later which time of the year is the most critical.
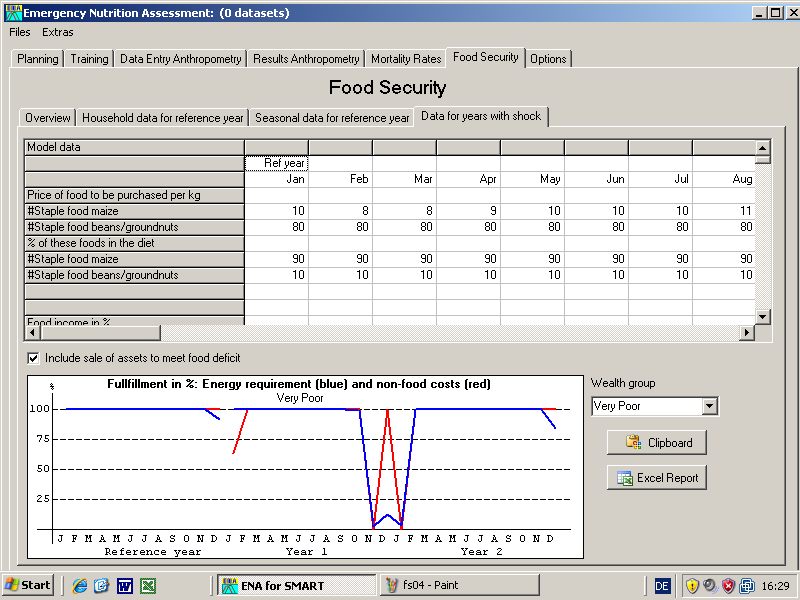
In the last sheet some additional information can be entered (food cost in reference year and year of crisis, information on the shock, food or cash aid, sale of assets) which is the basis for the graph in the lower part of the screen. This graph can be used to test various shock scenarios and interventions and to see which time will be the most critical.