ENA for
SMART - Software for Emergency Nutrition Assessment
The purpose of ENA for SMART is to make nutrition assessments and
mortality rate calculations in emergency situations as easy and
reliable as possible. To achieve this it focuses on the most important
indicators (anthropometric and mortality data), checks the
plausibility of the entered data and gives out an automatic report.
Since the software can not explain why children are malnourished or
mortality rates are high the results of the survey have to be
complemented with other information (e.g. from discussions with key
informants).
To install ENA click on the following file ena.exe. After installation you can find an icon for the
program on the desktop. Alternatively unzip the following ZIP file
in a new
directory and start ena.exe. Information for the updates can be found on the
following website (last update October
15th, 2007) and the new beta version at www.nutrisurvey.net/ena_beta.
The beta version is still under testing and should therefore only
be used for training and to see the new functionality. For a
french version of the software just copy the file
language.dat into the ENA directory (with the right
mouse button click on 'save target as', thanks to
Gwenola Desplats for translating the file).
The
program is thoroughly tested and the z-score calculation identical to
other programs (EpiInfo, WHO Anthro) but if you should encounter any problems or if you have suggestions for further improvements please send
an e-mail to juergen.erhardt@nutrisurvey.net
copied to mike@pollgorm.net.
For background information and a detailed description on how to use the
program please download the SMART methodology at
www.smartmethodology.org. To do a
reliable survey it is essential to work through this manual. In the manual the
old name of the software 'NutriSurvey for SMART' is still used. We changed the
name to reduce potential confusion with the general nutrition software
NutriSurvey.
Description of ENA:
The ENA software has different sheets (planning, training, data
entry, results, options) which follows the steps of a survey. The most
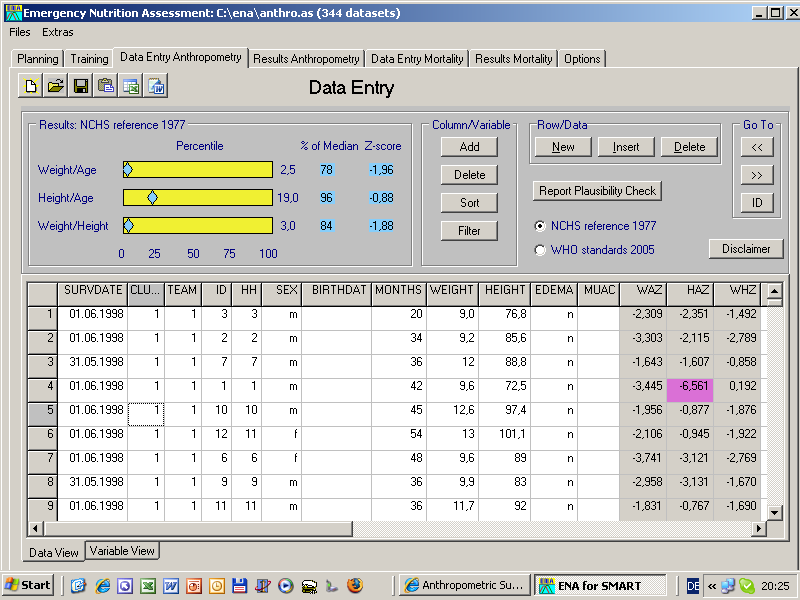
important is the data entry sheet which opens after starting the software.
The anthropometric data is entered in the data table in the lower part
of the screen, partly checked for the validity and made as easy as possible
(e.g. entering the birthdate as 10199 instead of 1/1/1999). After entering
a value please press the Enter key to jump to the next column. When the end
of the row is reached or with the 'New' button a new data sentence is added
and depending on the settings under 'Options' the Surveydate, Cluster,
Team, ID and Household No. is filled out automatically. The results (z-score
for weight/age, height/age and weight/height) are directly displayed in
the panel on the upper left corner and automatically integrated into the
data table. If the results are outside the min/max range they are marked
with purple color (the range can be changed under the variable view). Besides
the standard variables additional variables can be added.
This is a typical example (file anthro.as in
the directory of the software) of an anthropometric survey
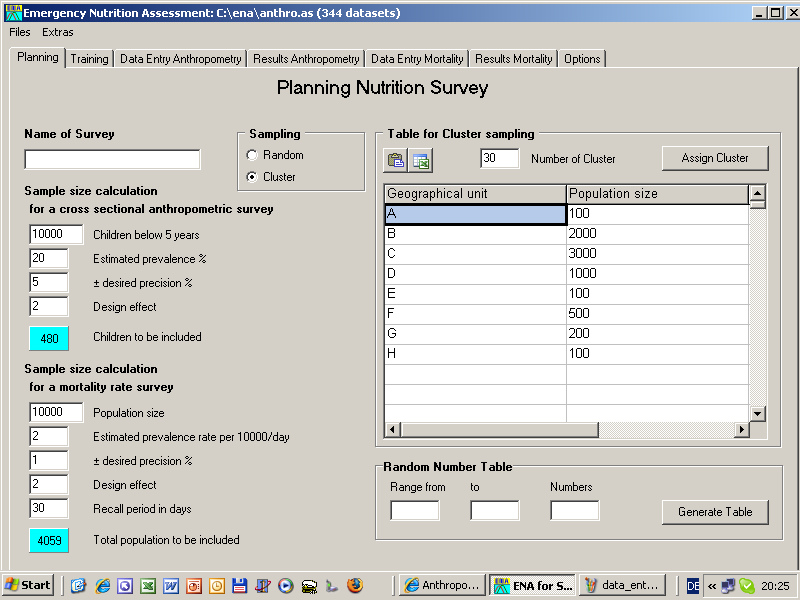
The planning sheet enables the sample size calculation
for an anthropometric or mortality rate survey. With the 'Table for
cluster sampling' it is possible to assign the clusters (e.g. 1-30) to
the geographical units (villages,..).
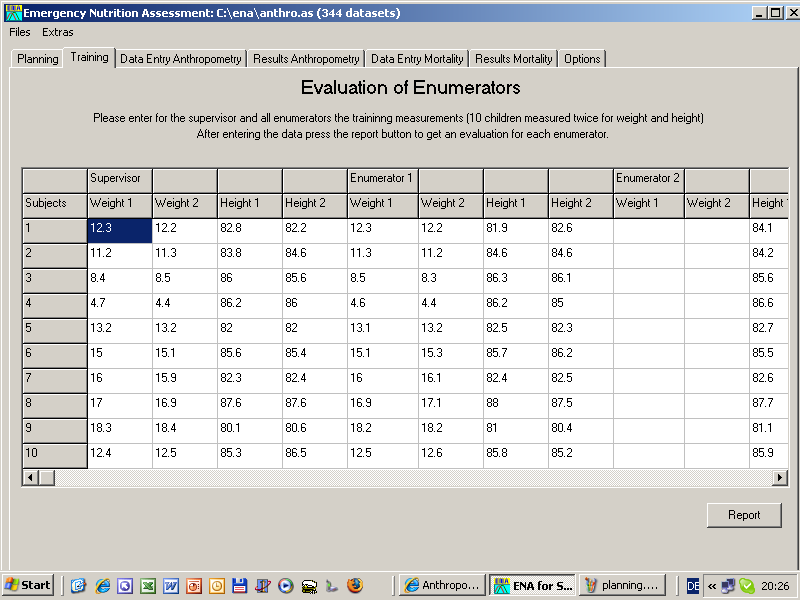
The following sheet is for the evaluation of the enumerators.
Before a survey each enumerator should independently measure 10 children
two times
for weight and height. The software calculates the precision and accuracy
and gives a comment on the results (if 10 children are not available a
lower number may be taken).
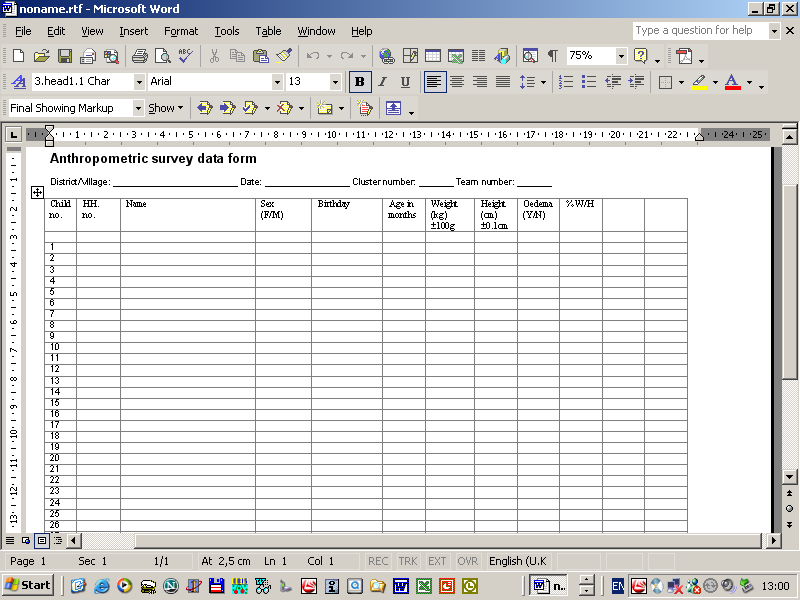
Under the 'Extras' Menu a survey form can be printed which
has a similar format as the data table
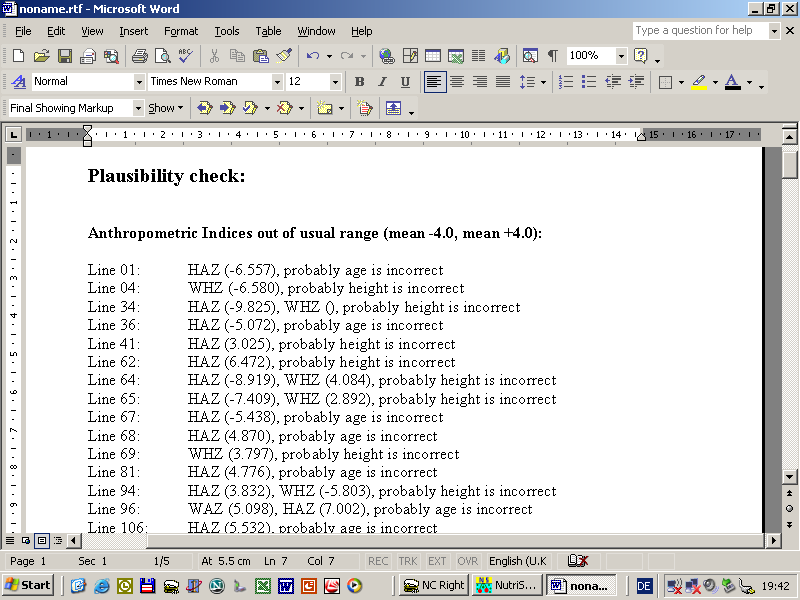
With the button 'Plausibility Check' it is possible
to check the database for the most common problems and suggestions
are given on how to solve them.
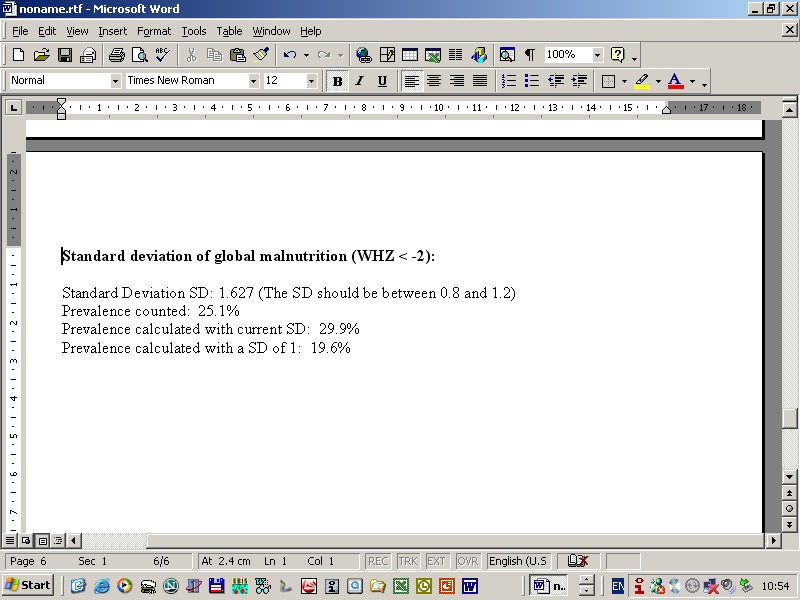
This part of the plausibility report shows that the standard deviation
is relatively high (mostly caused by inaccurate measurements) and therefore
the rate of malnutrition is higher than it would be with a normal standard
deviation.
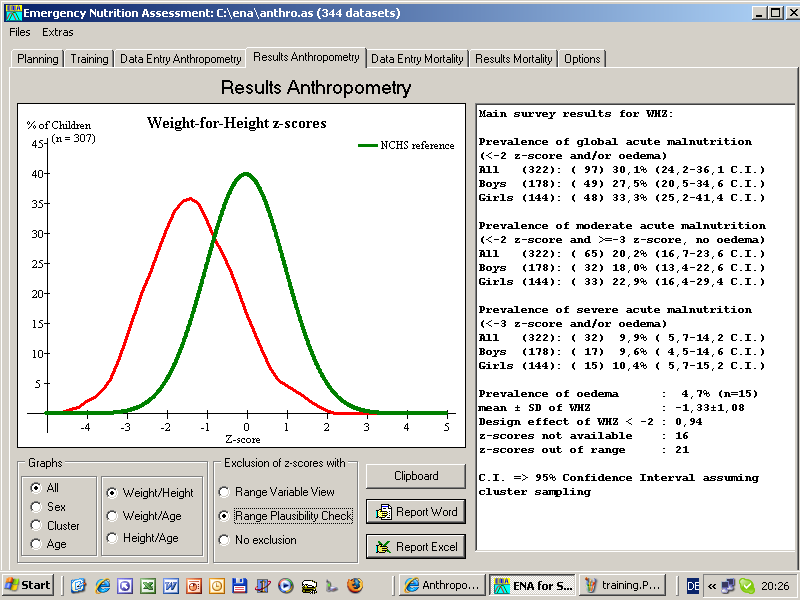
Under 'Results Anthropometry' the distribution of
the anthropometric indices in comparison to the NCHS reference or the
WHO standards is produced. Additionally it is possible to make bar graphs for the
different z-score indicators and some variables (sex, cluster,
age). In the right box the most important results of the survey are shown.
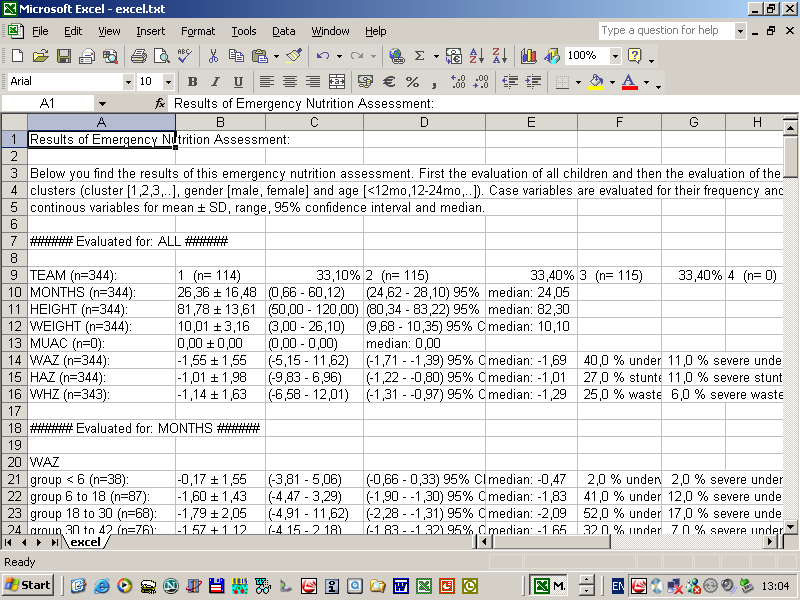
Click on the 'Report Excel' button to get a more detailed
evaluation.
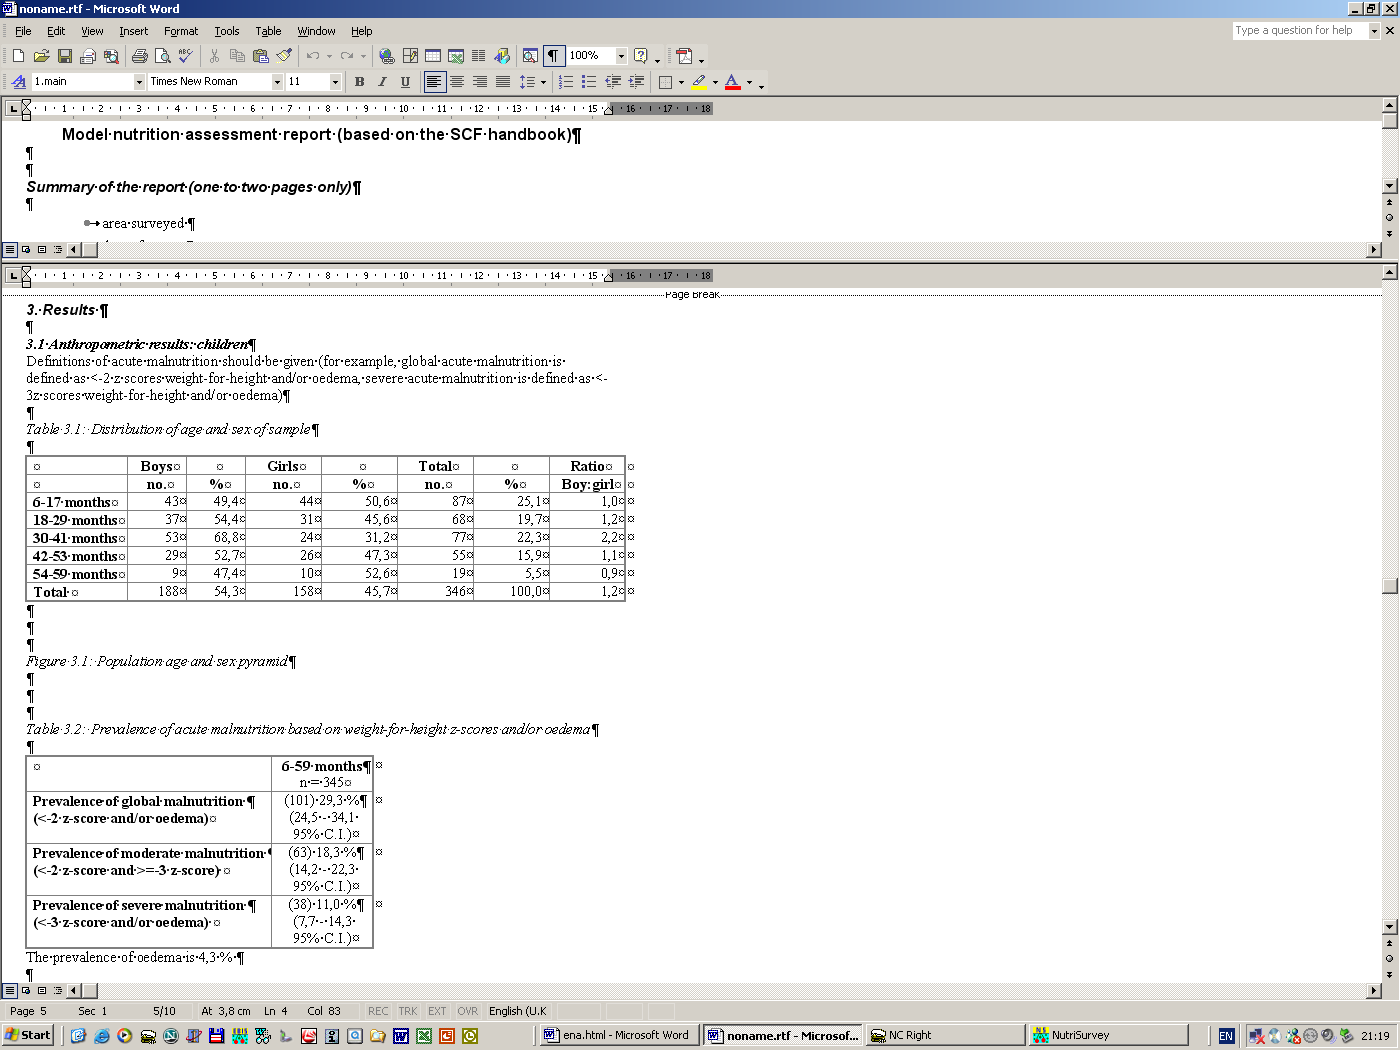
A formated report can be made automatically with
the 'Report in Word' button. It contains the most important results
in a nearly final format.
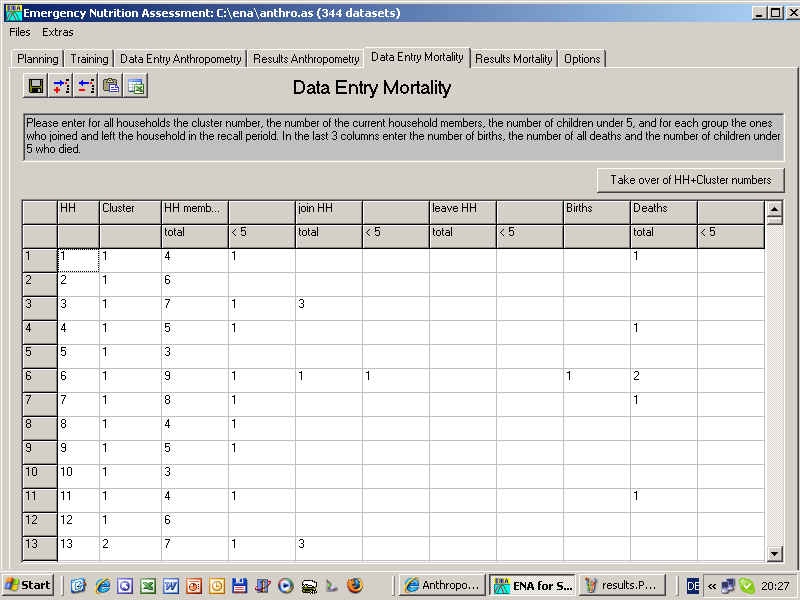
In the sheet 'Data Entry Mortality' the data for a mortality
survey can be entered,
and evaluated in the sheet 'Results Mortality'.

Under 'Options' the settings of the software can be changed

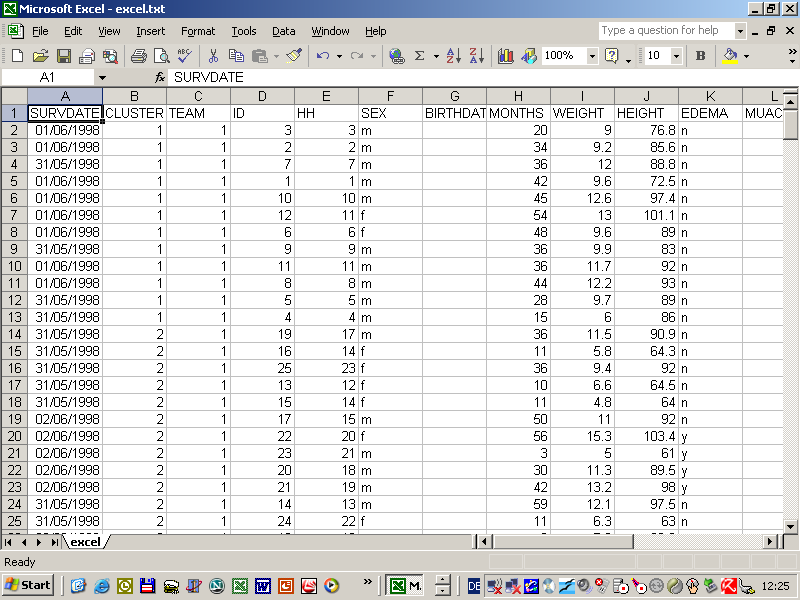
The data can also be easily transfered to Excel and pasted back to ENA.
From Excel it is very easy to transfer the data into other programs
e.g. EPI Info which has a simple import function for Lotus (*.wks)
files which makes it possible to do special statistical calculations.