6.1. Examples of questionnaires
In nutrition baseline surveys the questionnaires are divided into community, household, individual (child) and supervisor questionnaires. The household questionnaires are further divided into samples adapted to urban and rural households, as there are some significant differences in socioeconomic and ecological descriptions of the two types of circumstances. In the Nutrition Baseline software only the questionnaires for the household and child are prepared automatically depending on the settings in the option sheet. Samples of the other two can be found in the following two chapters.
It should be emphasized here,
once again, that these forms can only be used as a sample in order to become
accustomed to the methods for formulating questionnaires. Obviously,
content and language must always be adapted to the circumstances of the
survey area. Item-by-item explanations for the planning and preparation
of questionnaires are presented in Chapter 3.2.
6.1.1.
Example of a Community Questionnaire
| Community | ||
| No. of Sub-Communities: | ||
| No. Inhabitants: | ||
| Major source of income: | ||
| Infrastructure, Schools: | 0 - Not available
1 - Primary School 2 - Secondary School |
|
| Health facilities: | 0 - Not available
1 - Health post 2 - Health center |
|
| Shopping facilities: | 0 - None
1 - Shop 2 - Market 3 - Kiosk (small) |
|
| Communication facilities: | 1 - Postal service
2 - Newspaper 3 - Radio 4 - Television 5 - Telephon |
|
| Mass transportation means: | 0 - Not available
1 - Pick-up/Truck 2 - Bus/Minibus 3 - Boat |
|
| Type of road: | 0 - No roads available
1 - Earth 2 - Stone 3 - Asphalt |
|
| Meeting place: | 0 - None
1 - Open air 2 - Village Hall 3 - Religious Center |
|
| Worship place: | 0 - None
1 - Available |
|
| Sport facilities: | 0 - None
1 - Available |
6.1.2.
Example of a Supervisor questionnaire
1.) Household number
2.) Supervisor
1) A
2) B
3) C
3.) Survey team
1) A
7) G
2) B
8) H
3) C
9) I
4) D
10) J
5) E
11) K
6) F
12) L
4.) Date of survey (day, month, year)
5.) Place of survey (village/suburb)
1) A
9) I
2) B
10) J
3) C
11) K
4) D
12) L
5) E
13) M
6) F
14) N
7) G
15) O
8) H
6.) Question: Name of child
7.) Observation: Age of the child (months)
8.) Question: Age of the mother (years)
9.) Question: How large is your farming operation? (ha)
10.) Question:
What is the ownership status of the land?
1) Own land
4) Public land
2) Leased land
8) Don't know
3) Owned and leased
land 9) No answer
11.) Question: Has your child suffered from a diarrheal disease during the last 7 days?
12.) Question: (If your child is not currently breastfed) how long did you breastfeed your child? (months)
13.) Question:
How many hours after birth did you start with breast feeding?
1) 1-4 hours
8) Don't know
2) 5-12 hours
9) No answer
3) After 12 hours
14.) Question:
Did your child receive any other fluid after birth besides colostrum?
1) Yes
8) Don't know
2) No
9) No answer
15.) Question:
Regardless of whether your child is breastfed or not, how often was your
child given something to eat yesterday?
8) Don't know
9) No answer
16.) Observation:
Does the child possess an immunization record?
1) Yes 2)
No
17.) Measurement: Weight of the child (kg)
18.) Measurement: Height of the child (cm)
19.) Measurement:
Mid Upper Arm Circumference (cm)
The following list gives all unique code names in alphabetic order. The variable number indicate the numbers of the variables that are discribed in chapter 3.2. The numbers that are marked with (*) are codes that are not considered in the forms as own variable. However, a specific code variable is given in case that these variables shall be considered in the spreadsheet for further statistical analysis.
No. Variable Code Description
1. ADDDRINK
Fluid given to child in addition to breast-milk today
2. ADDITBF
Fluid given to child after birth besides breast-milk
3. *AGE
Age of child (months)
4. AGEMOTHE
Actual age of mother
5. AGEOLDCH
Age of mother when oldest child was born
6. AGESOLID
Age child was first given solid foods
7. AGEYOUNG
Age of mother when youngest child was born
8. ANIMALFT
Food frequency of animal fats
9. ANIMAL1
Use of animal 1
10. ANIMAL2
Use of animal 2
11. ANIMAL3
Use of animal 3
12. ANIMAL4
Use of animal 4
13. BIRTHDAT
Birthdate of the child
14. BIRTHSPA
Number of cases with birth spacing of < 2 years
15. *BMI
Body mass index of mother
16. BOTTLE
Status of bottle-feeding of child
17. BREASTDU
Months child was breast-fed
18. BREASTFE
Current breast-feeding status
19. CARERESP
Identification of person who takes care of children
20. CHILDDTH
Preschool children mortality
21. CHILDNO
Child number
22. COLOSTRU
Child received colostrum
23. CROP1
Use of crop 1
24. CROP2
Use of crop 2
25. CROP3
Use of crop 3
26. CROP4
Use of crop 4
27. EATFREQU
Eating frequency of child per day
28. EATGREEN
Vegetables or fruits as supplementary feeding
29. EATSOLID
Solid food as supplementary feeding
30. EDUCFATH
Formal schooling of father
31. EDUCMOTH
Formal schooling of mother
32. EGG
Food frequency of eggs and egg products
33. ELECTRIC
Electricity supply of household
34. ENERCOOK
Kind of energy used for cooking
35. ETHNIREL
Ethnic or religious affiliation of mother
36. FARMAREA
Area of farming operation (ha)
37. FISH
Food frequency of fish and other seafood
38. FOAPRIL
Food shortage in April
39. FOAUGUST
Food shortage in August
40. FODECEMB
Food shortage in December
41. FOFEBRUA
Food shortage in February
42. FOJANUAR
Food shortage in January
43. FOJUNE
Food shortage in June
44. FOJULY
Food shortage in July
45. FOMARCH
Food shortage in March
46. FOMAY
Food shortage in May
47. FONOVEMB
Food shortage in November
48. FOOCTOBE
Food shortage in October
49. FOODAID
Participation on feeding program
50. FOSEPTEM
Food shortage in September
51. FRUITS
Food frequency of fruits
52. GARBAGE
Kind of garbage disposal
53. GENDPREF
Gender preference regarding the next child
54. GREENVEG
Food frequency of green leafy vegetables
55 *HFA
Height-for-age of child (z-score)
56. HEIGHT
Height of child (cm)
57. HEMOGLCH
Hemoglobin level in blood of child (g/L)
58. HEMOGLMO
Hemoglobin level in blood of mother (g/L)
59. HSHHDSEX
Gender of head of household
60. HSHLOCAT
Location of househould (name of village or suburb)
61. HSHMEMNO
Number of household members
62 HSHMMNO
Number of household members earning money
63. HOUSEHNO
Household number
64. IMMUNCRD
Presence of immunization record of child
65. INFODAY
Suggested week day for survey meeting
66. INFOTIME
Suggested time of day for survey meeting
67. LANDOWN
Ownership of land
68. MEATLARG
Food frequency of meat from large animals
69. MEATSMAL
Food frequency of meat from small animals
70. MILK
Food frequency of milk and milk products
71. MOGOITER
Goiter in mother
72. MOHEIGHT
Height of mother (cm)
73. MOTHMONE
Money earned by mother during the last 3 months
74. MOWEIGHT
Weight of mother (0.1 kg)
75. MUAC
Mid upper arm circumference
76. NBEDROOM
Number of bedrooms
77. NIGHTBLI
Nightblindness of child
78. NOCLDMEM
Number of members of household who are children
79. OCCUPACI
Occupation of head of household
80. OIL
Food frequency of oils
81. ORIGIN
Geographical origin of mother
82. OTHERVEG
Food frequency of other than green leafy vegetables
83. PERIOARI
Period prevalence of acute respiratory diseases
84. PERIODDD
Period prevalence of diarrheal disease of child
85. PERIODIS
Period prevalence of other important disease
86. *PERSOBED Number
of persons per bedroom
87. POINTARI
Point prevalence of acute respiratory diseases
88. POINTDD
Point prevalence of diarrheal disease of child
89. PLANTFAT
Food frequency of plant fats
90. PREGNANT
Time of pregnancy of mother
91. PREPARED
Food frequency of pre-prepared, processed food
92. PROBDISP
Household with neighbor disputes
93. PROBEDUC
Household with unsatisfactory school situation
94. PROBENER
Household with problems of energy supply
95. PROBFOOD
Household with problems of food supply
96. PROBILLN
Household with frequent disease problems
97. PROBINCO
Household with too little income
98. PROBLE1
Household with land tenure problems
99. PROBLE2
Household with employment/yield problems
100. PROBLE3
Household with time problems to get to work
101. PROBLIVC Household
with bad living conditions
102. PROBNO
Household without problems
103. PROBOTHE Household
with other problems
104. PROBWATE Household
with problems of water supply
105. SALTIOD
Presence of iodine in salt sample
106. SALTYP
Kind of salt used in cooking and as table salt
107. SCHOOLFD Participation
on schoolfeeding program
108. SEWAGE
Kind of sewage disposal
109. SEX
Gender of child
110. SNACKS
Food frequency of snacks
111. SOCIALIF Participation
in social meetings
112. STAPLE1
Food frequency of staple food 1 (grains, tubers)
113. STAPLE2
Food frequency of staple food 2 (grains, tubers)
114. STAPLE3
Food frequency of staple food 3 (grains, tubers)
115. STAPLE4
Food frequency of staple food 4 (grains, tubers)
116. STARTBF
Start of breast-feeding after birth
117. SUGAR
Food frequency of sugars
118. SUPERVNO Supervisor
119. SURVTNO
Survey team number
120. SURVDATE Date
of the survey
121. SURVDISC Interest
in discussion about results of survey
122. SURVPART Acceptance
of survey by responder
123. WAAPRIL
Water shortage in April
124. WAAUGUST Water
shortage in August
125. WADECEMB Water
shortage in December
126. WAFEBRUA Water
shortage in February
127. WAJANUAR Water
shortage in January
128. WAJUNE
Water shortage in June
129. WAJULY
Water shortage in July
130. WALL
Material of walls of children's bedroom
131. WAMARCH
Water shortage in March
132. WAMAY
Water shortage in May
133. WANOVEMB Water
shortage in November
134. WAOCTOBE Water
shortage in October
135. WASEPTEM Water
shortage in September
136. WATER
Source of drinking water
137. WEIGHING Weighing
status of child
138. WEIGHT
Weight of child (0.1 kg)
139. *WFA
Weight-for-age of child (z-score)
140. *WFH
Weight-for-height of child (z-score)
141. WHTCHART Presence
of weighing chart of child
6.3 Anthropometric Reference Tables
Sometimes a nutrition survey
must be made without being able to calculate anthropometric data using
a personal computer. In this instance, one can use the age, weight and
height data for a child to determine if the child is within the normal
variation of the population. These anthropometric standard values are based
on the NCHS/CDC reference values as recommended by the WHO. Threshold values
are given for stunting, wasting, and obesity. Thresholds are given for
plus or minus two standard deviations from the reference population. In
addition to values for stunting, wasting and obesity according to height,
thresholds for obesity vs. age are also given.
Thresholds for stunting (ht/age)
and underweight (wt/age) in boys and girls (age : <2 years) in lying
position
|
|
|
|
||
|
(Months) |
(Z-score: -2) Height in lying position (cm) |
(Z-score: -2) Weight (kg) |
(Z-score: -2) Height in lying position (cm) |
(Z-score: -2) Weight (kg) |
|
1 2 3 4 5 |
49.7 52.9 55.8 58.3 60.5 |
2.9 3.5 4.1 4.7 5.3 |
49. 0 52. 0 54. 6 56. 9 58. 9 |
2. 8 3. 3 3. 9 4. 5 5. 0 |
|
7 8 9 10 11 |
64.1 65.7 67.0 68.3 69.6 |
6.4 6.9 7.2 7.6 7.9 |
62. 2 63. 7 65. 0 66. 2 67. 5 |
5. 9 6. 3 6. 6 6. 9 7. 2 |
|
13 14 15 16 17 |
71.8 72.8 73.7 74.6 75.5 |
8.3 8.5 8.7 8.8 9.0 |
69. 8 70. 8 71. 9 72. 9 73. 8 |
7. 6 7. 8 8. 0 8. 2 8. 3 |
|
19 20 21 22 23 |
77.1 77.9 78.9 79.4 80.2 |
9.2 9.4 9.5 9.7 9.8 |
75. 7 76. 6 77. 4 78. 3 79. 1 |
8. 6 8. 8 9. 0 9. 1 9. 3 |
Thresholds for stunting
(ht/age) and underweight (wt/age) (age: 2 - 5 years) in upright position
|
|
|
|
||
|
(Months) |
(Z-score: -2) Height in upright position (cm) |
(Z-score: -2) Weight
|
(Z-score: -2) Height in upright position (cm) |
(Z-score: -2) Weight
|
|
25 26 27 28 29 |
79. 9 80. 6 81. 3 82. 0 82. 7 |
10. 2 10. 3 10. 4 10. 5 10. 6 |
78. 8 79. 6 80. 3 81. 0 81. 7 |
9. 6 9. 8 9. 9 10. 1 10. 2 |
|
31 32 33 34 35 |
84. 1 84. 7 85. 4 86. 0 86. 7 |
10. 9 11. 0 11. 1 11. 2 11. 3 |
83. 2 83. 8 84. 5 85. 2 85. 8 |
10. 5 10. 6 10. 8 10. 9 11. 0 |
|
37 38 39 40 41 |
87. 9 88. 6 89. 2 89. 8 90. 4 |
11. 5 11. 7 11. 8 11. 9 12. 0 |
87. 1 87. 7 88. 4 89. 0 89. 6 |
11. 3 11. 4 11. 5 11. 6 11. 8 |
|
43 44 45 46 47 |
91. 6 92. 2 92. 7 93. 3 93. 9 |
12. 3 12. 4 12. 5 12. 6 12. 8 |
90. 7 91. 3 91. 9 92. 5 93. 0 |
12. 0 12. 1 12. 2 12. 3 12. 5 |
|
49 50 51 52 53 |
95. 0 95. 5 96. 1 96. 6 97. 1 |
13. 0 13. 1 13. 3 13. 4 13. 5 |
94. 1 94. 6 95. 1 95. 6 96. 2 |
12. 7 12. 8 12. 9 13. 0 13. 1 |
|
55 56 57 58 59 |
98. 2 98. 7 99. 2 99. 7 100. 2 |
13. 9 14. 1 14. 2 14. 2 14. 3 |
97. 2 96. 6 98. 1 98. 6 99. 1 |
13. 3 13. 4 13. 5 13. 6 13. 7 |
Thresholds for wasting
(wt/ht) and obesity (wt/ht) (length in lying position: 49 - 100 cm)
|
|
|
|
||
|
(cm) |
(Z-score: -2) Weight (kg) |
(Z-score: +2) Weight (kg) |
(Z-score: -2) Weight (kg) |
(Z-score: +2) Weight (kg) |
|
|
|
|
|
|
|
51 52 53 54 |
2. 6 2. 8 2. 9 3. 1 |
4. 6 4. 8 5. 0 5. 3 |
2. 7 2. 8 3. 0 3. 1 |
4. 4 4. 7 4. 9 5. 2 |
|
56 57 58 59 |
3. 5 3. 7 3. 9 4. 1 |
5. 9 6. 1 6. 4 6. 7 |
3. 5 3. 7 3. 9 4. 1 |
5. 7 6. 0 6. 3 6. 6 |
|
61 62 63 64 |
4. 6 4. 9 5. 2 5. 4 |
7. 4 7. 7 8. 0 8. 3 |
4. 6 4. 8 5. 0 5. 3 |
7. 2 7. 5 7. 8 8. 1 |
|
66 67 68 69 |
6. 0 6. 2 6. 5 6. 8 |
9. 0 9. 3 9. 6 9. 9 |
5. 8 6. 0 6. 3 6. 5 |
8. 7 9. 0 9. 3 9. 6 |
|
71 72 73 74 |
7. 3 7. 5 7. 8 8. 0 |
10. 5 10. 8 11. 1 11. 4 |
7. 0 7. 2 7. 5 7. 7 |
10. 2 10. 5 10. 7 11. 0 |
|
76 77 78 79 |
8. 4 8. 6 8. 8 9. 0 |
11. 9 12. 1 12. 4 12. 6 |
8. 1 8. 3 8. 5 8. 7 |
11. 4 11. 7 11. 9 12. 1 |
|
81 82 83 84 |
9. 4 9. 6 9. 7 9. 9 |
13. 1 13. 3 13. 5 13. 7 |
9. 0 9. 2 9. 4 9. 6 |
12. 6 12. 8 13. 0 13. 2 |
|
86 87 88 89 |
10. 3 10. 5 10. 6 10. 8 |
14. 2 14. 4 14. 7 14. 9 |
9. 9 10. 1 10. 3 10. 5 |
13. 6 13. 9 14. 1 14. 3 |
|
91 92 93 94 |
11. 2 11. 4 11. 6 11. 9 |
15. 3 15. 6 15. 8 16. 1 |
10. 9 11. 1 11. 3 11. 5 |
14. 8 15. 0 15. 3 15. 6 |
|
96 97 98 99 |
12. 3 12. 5 12. 8 13. 0 |
16. 6 16. 8 17. 1 17. 4 |
12. 0 12. 2 12. 5 12. 8 |
16. 1 16. 5 16. 8 17. 1 |
|
|
|
|
|
|
Thresholds for wasting
(wt/ht) and obesity (wt/ht) (stature, upright position: 75 - 127 cm)
|
|
|
|
||
|
(cm) |
(Z-score: -2) Weight (kg) |
(Z-score: +2) Weight (kg) |
(Z-score: -2) Weight (kg) |
(Z-score: +2) Weight (kg) |
|
76 77 78 79 |
8. 1 8. 3 8. 5 8. 7 |
12. 9 13. 2 13. 4 13. 6 |
7. 9 8. 1 8. 3 8. 5 |
12. 5 12. 7 13. 0 13. 2 |
|
81 82 83 84 |
9. 2 9. 4 9. 6 9. 7 |
14. 1 14. 3 14. 6 14. 8 |
8. 9 9. 1 9. 3 9. 5 |
13. 6 13. 9 14. 1 14. 3 |
|
86 87 88 89 |
10. 1 10. 3 10. 5 10. 7 |
15. 3 15. 5 15. 7 15. 9 |
9. 9 10. 1 10. 3 10. 5 |
14. 8 15. 1 15. 3 15. 6 |
|
91 92 93 94 |
11. 1 11. 3 11. 5 11. 7 |
16. 4 16. 7 16. 9 17. 2 |
10. 8 11. 0 11. 2 11. 4 |
16. 1 16. 3 16. 6 16. 9 |
|
96 97 98 99 |
12. 1 12. 4 12. 6 12. 8 |
17. 7 17. 9 18. 2 18. 5 |
11. 8 12. 0 12. 2 12. 4 |
17. 5 17. 8 18. 1 18. 4 |
|
101 102 103 104 |
13. 2 13. 5 13. 7 13. 9 |
19. 1 19. 4 19. 7 20. 0 |
12. 9 13. 1 13. 3 13. 5 |
19. 0 19. 3 19. 6 20. 0 |
|
106 107 108 109 |
14. 4 14. 7 14. 9 15. 2 |
20. 7 21. 1 21. 4 21. 8 |
14. 0 14. 3 14. 5 14. 8 |
20. 7 21. 0 21. 4 21. 8 |
|
111 112 113 114 |
15. 7 16. 0 16. 3 16. 6 |
22. 6 23. 1 23. 5 24. 0 |
15. 3 15. 6 15. 9 16. 2 |
22. 5 23. 0 23. 4 23. 8 |
|
116 117 118 119 |
17. 2 17. 5 17. 9 18. 2 |
24. 9 25. 4 26. 0 26. 5 |
16. 8 17. 1 17. 4 17. 7 |
24. 8 25. 3 25. 8 26. 4 |
|
121 122 123 124 |
18. 9 19. 2 19. 6 20. 0 |
27. 6 28. 2 28. 9 29. 5 |
18. 4 18. 8 19. 1 19. 5 |
27. 6 28. 3 29. 0 29. 7 |
|
126 127 |
20. 7 21. 1 |
30. 9 31. 6 |
- - |
- - |
Thresholds for Wasting
(BMI<18.5) and Obesity (BMI>27.5)
|
Stature (cm) |
(BMI: 18.5) Weight (kg) |
(BMI: 27.5) Weight (kg) |
| 145
146 147 148 149 |
39. 4 40. 0 40. 5 41. 1 |
58. 6 59. 4 60. 2 61. 1 |
| 150
151 152 153 154 |
42. 2 42. 7 43. 3 43. 9 |
62. 7 63. 5 64. 4 65. 2 |
| 155
156 157 158 159 |
45. 0 45. 6 46. 2 47. 4 |
66. 9 67. 8 68. 7 69. 5 |
| 160
161 162 163 164 |
48. 0 48. 6 49. 2 49. 8 |
71. 3 72. 2 73. 1 74. 0 |
| 165
166 167 168 169 |
51. 0 51. 6 52. 2 52. 8 |
75. 8 76. 7 77. 6 78. 5 |
| 170
171 172 173 174 |
54. 1 54. 7 55. 4 56. 0 |
80. 4 81. 4 82. 3 83. 3 |
| 175
176 177 178 179 |
57. 3 58. 0 58. 6 59. 3 |
85. 2 86. 2 87. 1 88. 1 |
| 180
181 182 183 184 |
60. 6 61. 3 62. 0 62. 6 |
90. 1 91. 1 92. 1 93. 1 |
Nutrient requirements depend on the biological status of a person (gender, age, build, pregnancy, breastfeeding, etc.), health and nutritional conditions, physical activities and the body heat produced by the person. In addition to these, allowance must be made for external variables, such as ambient temperature and nutrient reserves, and increased needs under some environmental conditions - for example in order to counteract increased attacks by infections or irregular feeding.
Even if these conditions have been accurately determined, there is not always agreement at the international level. Nutritional recommendations are not consistent from one country to another. These differences are evident in the nutrient recommendations published over the last ten years.
The nutrient requirements listed on the following pages have been adapted from FAO/WHO recommendations. These recommendations are accepted in most developing countries.
Table 11. Average Energy
and Protein Requirements of Infants and Small Children
|
|
|
|
|
||||
| kcal/kg | kJ/kg | kcal/day | kJ/day | g/kgc | g/dayc | ||
| Months: | |||||||
| 3-6
6-9 9-12 |
7
8.5 9.5 |
100
95 100 |
418
397 418 |
700
810 950 |
2300
3400 4000 |
1.85
1.65 1.50 |
13
14 14 |
| Years: | |||||||
| 1-2
2.3 3-5 |
11
13.5 16.5 |
105
100 95 |
439
418 397 |
1150
1350 1550 |
4800
5700 6500 |
1.20
1.15 1.10 |
13.5
15.5 17.5 |
a Average weight for boys
and girls at the mean age of the age group according to NCHS.
b Based on the protein
quality (amino acid content and digestibility) of eggs or milk.
c Rounded to the nearest
0.05 or 0.5
World Health Organization (1985), Energy
and protein requirements, Report of a Joint FAO/WHO/UNU Expert Consultation,
Technical Report Series 724, WHO, Geneva
The randomized number table on the following two pages consist of the 5,000 digits zero to nine in random order. From the point of view of statistical accuracy, if such tables are used repeatedly they cannot be considered "random." However, for practical use in evaluating surveys they are quite sufficient. It is advisable to obtain a new set of random numbers from time to time to replace the old ones.
Statistical textbooks contain random number tables for determining random sequences. If you have such tables available, these also can be used.
The digits in the tables may either be read from left to right or from top to bottom. When a row of numbers is finished then the next one down is taken. Similarly when using columns take the next one right. Assume that a randomly selected number between one and five is required. Go arbitrarily to any position in the table and read right for the next number between one and five. When you find such a number that is your randomly selected number. If you need another such number then start one over from where you finished last time, no matter where in the group of digits that may be. If you want a number with two digits then the first digit is in the ten's place and the second in the unit's place.
Every time a new number is sought you should start immediately after the previous identified number. Therefore mark the last digit used each time with a pencil.
Table 12. Randomized numbers
0 1 2 3 4 5 6 7 8 9
0 59894 12161 60017 54948
45889 84002 53390 00386 09974 42942
1 36638 57682 82157 75236
15013 04478 24344 20134 03219 16422
2 18134 34678 81756 91082
64920 84396 86973 41828 01084 54335
3 08971 20750 47001 25140
82781 21128 91527 54397 37148 83053
4 77858 82288 15606 69731
64180 06684 59604 83386 85501 59111
5 28155 21474 24559 42851
68312 78638 07337 36209 88222 36321
6 64244 55237 79445 67676
38589 21596 69454 33332 62103 71010
7 84527 81383 39580 97882
34713 07567 62000 54562 99003 47527
8 60637 95417 01655 24389
47676 10846 51697 41868 89061 92304
9 67185 14448 65666 15129
98140 11435 56872 61624 75319 86429
10 84867 34444 48296 30314 46645
97312 00382 31990 19571 87550
11 67726 35108 02092 28688 69855
67782 80856 44613 81416 25652
12 22590 53549 53132 13576 89810
38804 12742 63263 07314 77356
13 98256 69696 37975 65444 91969
15821 18313 52475 57442 40871
14 96887 07346 22199 05775 38284
56418 68081 88167 57441 72314
15 41726 17042 84357 36789 87063
74298 77368 07509 20477 44428
16 02478 79787 24505 04336 64329
36714 95953 99966 64670 94482
17 60665 90351 47623 94771 38658
34888 61333 25702 77802 55660
18 05633 69585 62760 46055 36368
64071 61925 66912 62756 68569
19 23268 92767 23349 18108 97470
82625 53859 30831 57548 00430
20 75667 13924 93820 32535 71745
33648 88736 53869 94335 73074
21 88723 45432 33459 09728 20055
91780 26544 40596 96749 33488
22 52869 76944 33982 14236 44819
92626 63955 34411 10628 11044
23 20472 60192 40431 48094 63991
69972 97926 94290 86854 24325
24 27138 05002 16419 16862 38965
91742 62237 33525 05062 36222
25 01372 91112 38460 08183 54099
27957 22380 80641 00536 18372
26 93123 34477 54515 71820 68076
48672 45203 52246 86073 37355
27 03329 83243 40113 41306 39158
74316 78975 70461 96806 78551
28 81932 57206 19496 65044 62464
85314 02335 82652 21065 90751
29 57795 15755 01736 24770 53011
57617 35043 49201 60833 75054
30 71541 44832 57657 78895 58013
80311 90970 88068 67880 52318
31 09450 88811 04243 20173 23783
86761 17666 44034 74815 71084
32 17776 01586 41633 54126 68224
82168 26743 49436 77304 82753
33 59654 06792 38986 91957 96697
33195 71024 20167 03048 68769
34 48299 47003 14745 38254 19621
24271 49653 65723 17507 64233
35 80783 93479 41019 12446 65966
73456 62851 90802 86619 80305
36 26589 39905 50295 52587 14356
22968 62598 39239 27332 66725
37 40703 76909 23212 82165 03971
02166 18643 14031 60420 53829
38 74702 66799 38493 41793 81902
88827 17551 04772 76847 68755
39 66750 16069 61482 27006 33612
23763 08634 07805 68651 33737
40 61242 06100 76487 52698 89181
79142 87077 60174 62738 94121
41 88168 86400 25680 03749 31223
02079 83426 75777 61584 56781
42 69487 45373 65467 06945 41539
63272 12192 35054 52066 90316
43 78180 88305 47987 29043 36868
98199 33931 03067 16052 75936
44 36313 03238 96836 11401 12431
33405 68153 91732 60871 77374
45 41405 13690 42314 08362 76226
08231 15919 82774 43572 62708
46 33185 14776 80559 08194 13535
01485 14233 94568 62409 84853
47 79689 56567 08561 05145 55956
19365 47294 99096 69428 17084
48 00113 02735 15268 03053 16466
75174 26704 45636 75908 90351
49 68222 85394 92000 73983 76136
20113 89236 87045 82930 04874
50 62111 70722 57056 47585 00578
77467 07900 04571 15488 83241
51 29928 39172 01938 39455 50717
87896 40990 83711 77947 08851
52 30974 61120 76749 65525 33742
66239 67961 32244 35861 23069
53 10049 04919 43742 05962 35709
77620 19039 75262 71003 80510
54 16587 24521 78973 64749 05300
12098 29144 54273 54338 43210
55 70895 44988 61256 82653 85303
83948 47351 94740 66865 78579
56 48472 84667 76880 00619 52843
04277 58294 56581 00253 72628
57 42529 79302 02240 79696 84366
42578 15240 67261 92166 21444
58 27394 66619 67608 33847 59586
56855 86950 05393 57594 52381
59 62415 83740 63241 17745 54207
27869 39010 11525 53274 84799
60 54532 44091 73936 09518 89543
58504 39431 56486 03832 64946
61 78971 66966 80259 24884 06339
37323 14763 26180 20626 87571
62 95032 43376 39938 20533 37634
29350 89984 68156 24941 01919
63 65516 02756 61982 40975 85222
91496 08482 27210 84989 74300
64 29970 10457 09977 25385 35707
01233 88818 31091 07100 49416
65 57984 18260 00511 28018 75217
03440 55231 85288 12683 61001
66 63736 89304 45416 14741 36506
70550 97706 83552 18358 02563
67 30916 19423 09633 53579 08788
44088 88278 02525 50545 63449
68 51554 74283 76308 43434 76771
88946 26086 89791 26818 90261
69 79340 81968 72766 49425 41586
51206 20675 14483 39131 47028
70 81685 11194 99495 28687 12385
03790 43830 52507 71625 82031
71 66594 57141 67847 87676 48832
45372 52958 32789 09071 26854
72 21445 83978 20693 78887 65156
22693 01957 89570 10880 23311
73 90181 29051 28483 65332 41777
42892 14840 64637 91223 12317
74 66669 35441 10416 77461 21342
68673 53101 27800 68670 15737
75 43396 48778 58343 44660 84910
80247 52922 92061 92823 89883
76 89263 28259 46385 68675 79244
80185 60179 01706 19352 20590
77 42769 81513 15432 39177 01788
74086 95010 32458 42006 42795
78 33039 24721 14463 10998 11901
04946 10670 45655 32885 56112
79 46153 53563 21084 29060 00647
81078 22411 23836 49568 98037
80 24264 62462 06936 81280 88554
63782 20191 13671 88837 57297
81 92829 12186 63959 78781 08419
88129 61302 40327 43046 17133
82 03871 31824 86163 47071 27718
33294 61583 07292 06049 46615
83 50979 29404 46052 45405 31699
27667 29955 15782 55318 29629
84 47755 17473 06336 14946 37813
45510 04863 58784 69084 12211
85 12258 74583 54811 22496 04953
92625 72800 14781 33974 62312
86 46605 83284 22740 33859 64186
03284 18958 16192 57526 22377
87 30395 70848 07873 65017 22859
65542 63883 49837 10588 20820
88 73905 15889 75418 83779 20966
48399 68894 29540 93319 56823
89 79202 07223 78401 29604 97469
27280 97388 98613 01872 55238
90 91147 39885 89998 72536 66987
57720 87624 27202 40171 61132
91 21082 94493 55337 78026 33981
08379 49774 37766 98289 34855
92 68775 15044 86329 70704 50754
99486 76101 93925 78272 19697
93 22402 26521 77779 57262 03856
48537 72373 84189 48273 97408
94 93273 84243 51177 05234 97835
96216 97046 19287 10932 09939
95 94033 66709 35126 49775 35020
63683 49408 27152 89896 01254
96 08628 46815 05455 16317 23667
42309 71775 41364 21980 53140
97 16929 21982 66287 88184 58914
18579 67526 10938 66656 94138
98 58207 85243 45426 45711 46807
17143 24243 87845 98620 80280
99 47124 77314 31839 99604 75720
95879 04290 14776 41652 44083
6.6
Sample presentations of survey findings in technical reports
The following pages give
examples of the presentation of findings in technical reports. The results
are presented as vividly as possible. As a rule, a technical report is
also aimed at readers who are not nutritional experts. To accomplish this,
the text and presentation must be set out in such a manner that non-experts
in the field are able to understand its contents. Tables and graphs should
be self-explanatory. Information in visual form in graphs can often be
much more informative and more readily understood than digital information
given in tables. The following pages give some examples of tables and graphs.
Table 13. Demographic
and socioeconomic characteristics of two low income urban communities in
Belo Horizonte, Brazil (1986).
| Characteristic | "Serra" | "St. Lucia/Vila Rita" | Total |
| Families surveyed
Children < 6 years Household members:
Length of residence
Living conditions:
|
80
153 6.1±2.7
12.0±9.0*
96.3
|
60
101 6.0±2.6
8.5±7.3*
88.3
|
140
254 6.1±2.7
10.5±9.0*
92.9
|
Table 14. Educational
level of parents in the Morro Sul suburb of Rio de Janeiro (1986)
| Educational level |
|
|
||
| (n) | (%) | (n) | (%) | |
| No formal education
(< 3 years schooling) 3-5 years schooling(a) 6-11 years schooling(b) > 11 years education No answer(c) |
58
102
|
22.1
38.6
|
47
85
|
17.9
32.1
|
Table 15. Prevalence
of anemia among children in the two urban communities in Belo Horizonte
(1986)
|
|
|
|
||||
| (n) | (%) | (n) | (%) | (n) | (%) | |
| Anemia
(Hb < 110.0 g/L) Severe anemia
Total children |
48
20
142 |
33.8
14.1
100.0 |
19
4
82 |
23.2
4.9
100.0 |
67
24
224 |
29.9
10.7
100.0 |
Table 16. Prevalence
of undernutrition among children of the observed villages in West Sumatra
(1994)
| Village | Height-for-agea | Weight-for-heighta | Weight-for-heighta |
| Gando
Koto Baru T Balai Gadang Badus Merapi Piliang B Batu Tebal Padang Luar S Lubuk Gadang Silayang All villages |
39.5
47.7 48.8 55.3 45.5 39.5 35.0 29.3 38.9 32.4 40.8 |
31.6
34.1 43.9 52.6 48.5 23.7 30.0 31.7 41.7 24.3 35.4 |
10.5
15.9 9.8 7.9 15.2 15.8 15.8 7.3 16.7 2.7 10.1 |
Table 17. Relationship
between anthropometric indices and age in under-five children of West Sumatra,
Indonesia (1994)
| Age
(months) |
Children
(n) |
Height-for-age
(mean: Z-score) |
Weight-for-height
(mean: Z-score) |
Weight-for-age
(mean: Z-score) |
| <6
6-12 12-18 18-24 24-36 > 36 |
54
66 51 39 69 108 |
-0.15±1.49
-0.94±1.12 -1.53±1.63 -1.85±1.33 -2.03±1.79 -2.59±1.18 |
-0.15±1.84
-0.76±1.08 -0.88±1.45 -1.19±1.32 -0.59±1.21 -0.54±1.04 |
-0.33±0.99
-1.34±1.04 -1.72±1.25 -1.86±1.16 -1.74±1.27 -1.94±0.93 |
Table 18. Relationship
between the presence of acute respiratory infections (ARI) and anthropometric
indices in children under-five children of West Sumatra, Indonesia (1994)
| ARI | Children
(n) |
Height-for-age
(mean: Z-score) |
Weight-for-height
(mean: Z-score) |
| Yes
No |
196
182 |
-0.81±1.24a
-0.44±1.40 |
-1.62±1.69
-1.65±1.57 |
Figure 13. Weight-for-height Z-scores of Indonesian children (N=168) from high-income families living in East-Jakarta (1994).
Figure 14. Frequency of body-mass-index of mothers from West-Kalimantan (1994)
6.7
Determination of intra- and inter observer errors.
Basically two types of errors can occur by taking anthropometric measurement of subjects during the survey:
Therefore the quality of the equipment, and the performance of the surveyors needs to be examined. This can be carried out by using the methodology as described in the following example.
Example:
A survey which will be carried out in 15 villages plans to use 5 enumerators for weight measurements and 5 weighing scales. The 5 weighing scales and 5 enumerators should be compared, using 5-10 subjects. Weighing scales will be numbered W1 through W5, and enumerators will be numbered E1 through E5.
First, Enumerator 1 should
weigh all subjects (S1- Sn) on weighing scale 1, E2 weighs all subjects
on W2, E3 on W3 and so forth. To ease the weighing process, the subject
that has been weighed in from E1 will pass to E2, then to E3, until the
last enumerator. In a second round, E1 will weigh again all subject now
with W2, E2 with E3 and finally E5 with E1. This process continues until
all enumerators have weighed all subjects with all scales. Each enumerator
fills out the following form with the results of the weighing.
|
|
|||||
| Subject | W1 | W2 | W3 | W4 | W5 |
| 1 | ...... kg | ...... kg | |||
| 2 | ...... kg | ||||
| 3 | |||||
| n | |||||
The results will then be analyzed using analysis of variance (ANOVA) with weight as dependent variable, and weighing scale (1 to 5), enumerator (1 to 5), and subject (1 to n) as factors. No significant effect should exist for weighing scale and for enumerator, and there should also be no significant interaction between these two factors.
In case there will be a significant
difference between weighing scales the faulty weighing scale should be
identified and replaced. In case one of the enumerators should weigh differently
from the others, the enumerators should be trained again in taking measurements.
The diagram on the following page provides an overview of the most relevant statistical tests. Before selecting a suitable statistical test for analysis of data, it is necessary to first determine some of the characteristics of the data.
The more information contained in the output data, the more clearly three steps can be distinguished :
Finally, the eventual selection of statistical methods depends on whether the statistics deal with only two factors (e.g. male-female, yes-no), or with more than two. Furthermore, the selection also depends on whether or not the data were collected from the same subject (e.g. a measurement for the same individual is taken at a different time).
If these characteristics are clearly understood, the suitable statistical test can be selected from the following table.
Table 19. Important Statistical
Tests
| Frequency | Ranking |
|
|||
|
|
|
||||
| Tests
for 2 factor steps
|
|
|
Tutzey-Test U-Test |
Smirnoff-Test |
b-test |
|
|
|
Spearman-Order Correlation Coefficient |
Product-moment Correlation Linear regression |
||
| Tests
for > 2 factor steps |
|
|
|
Student-Newman-Keuls-Test |
|
|
|
|
multiple comparison between Wilcoxon and Wilcox |
Multi-various methods |
||
For further guidance the following statistical handbook is recommended :
B.R. Kirkwood
Essentials of Medical Statistics
Blackwell Scientific Publications
Oxford, London, Edinburgh
6.9
Addresses of national and international institutions
Scientific and technical institutions:
Department
of Human Nutrition
London School of Tropical Medicine
and Hygiene.
Keppel Street (Gower Street)
London, WCIE 7 HT
England
Department of Human Nutrition
Agriculture
University
Postbus 8129
6700 EV Wageningen
Netherlands
Department of Nutrition
School
of Hygiene and Public Health
615 N. Wolfe Street
Baltimore, Maryland 21205
USA.
Department of Tropical Paediatrics
and International Health
Liverpool
School of Tropical Medicine
Pembroke Place
Liverpool, L3 SQA
England
Division
of Nutritional Sciences
Cornell University
Ithaca, New York 14853-0001
USA
Institute
of Child Health
Centre for International Child
Health
30 Guilford Street
London, WC1N 1EH
England
Institute of Food Economy
University of Kiel
Olshausenstr. 40
D-24098 Kiel
Germany
Instituto de Nutricion de Centro
America y Panama (INCAP)
Calzada Roosevelt Zona 11
Guatemala
Guatemala, C.A.
International
Food Policy Research Institute
1776 Massachusetts Avenue, N.W.
Washington, D.C. 20036
USA.
Program in International Nutrition
Department of Nutrition
University of California
Davis CA 95616 USA
SEAMEO-TROPMED
Center for Community Nutrition
University of Indonesia
Jl Salemba Raya 6
Jakarta 10430
Indonesia
Food and Agriculture Organization
of the United Nations System (FAO)
Food Policy and Nutritional Division,
Via delle Terme di Caracalla
I - 00100 Rome
Italy
and the following FAO regional sub-organizations:
African region
Regional Office for Africa (RAFR)
PO Box 1628
Accra
Ghana
Asian region
Regional Office for Asia and the
Pacific (RAPA)
Maliwan Mansion
Phra Atit Road
Bangkok 10200
Thailand
World Health Organization (WHO)
Nutrition
Unit
20, Avenue Appia
CH-1211 Geneva 27
Switzerland
and the following WHO regional sub-organizations:
Northern African region
Regional Nutritional Advisor
WHO/EMRO
P.O. Box 1517
Alexandria 21511
Arab Republic of Egypt
Africa, south of the Sahara
Regional Nutritional Advisor
World Health Organization/AFRO
Regional Office for Africa
Boite Postale 6
Brazzaville
Congo
Southern and Southeast Asian region
Regional Advisor in Nutrition
World Health Organization
Regional Office for South East
Asia
World Health House
Indraprastha Estate
Mahatma Gandhi Marg
New Delhi - 110 002
India
Pacific region
WHO/WPRO
United Nations Avenue
P.O. Box 2932
12115 Manilla
Philippines
European region
WHO/European Office for Europe
8 Scherfigsvej
DK-2100 Copenhagen 0
Denmark
United Nations Children's Fund
(UNICEF)
UNICEF House
3 United Nations Plaza
New York, N.Y. 10017
USA
and its regional sub-organizations
Northern African and Middle East region
UNICEF Middle East and North Africa
Regional Office
P.O. Box 811 721
Amman
Jordan
Western and Central African region
UNICEF West and Central Africa
Regional Office
Boite Postale 443
Abidjan 04
Ivory Coast
Eastern and Southern African region
UNICEF Eastern and Southern Africa
Regional Office
P.O. Box 44145
Nairobi
Kenya
South Central Asian region
UNICEF Regional Office for South
Central Asia
73 Lodi Estate
New Delhi 110 003
India
Southern and Eastern Asian region
UNICEF East Asia and Pakistan Regional
Office
P.O. Box 2-154
Bangkok 10200
Thailand
World Food Programme (WFP)
Via Cristoforo
Colombo, 426
I-00145 Rome
Italy
United Nations Development Programme
(UNDP)
One New York Plaza
New York, N.Y. 10017
USA
United Nations High Commissioner
for Refugees (UNHCR)
Center William Rappard
154, Rue de Lausanne
CH-1202 Geneva
Switzerland
United Nations Education and Culture
Organization (UNESCO)
7, Place de Fontenoy
F-75700 Paris
France
International Found for Agriculture
Development (IFAD)
Via del Serafico 107
I-00142 Rome
Italy
The World Bank
Population,
Health and Nutrition Department
1818 H Street N.W.
Washington, D.C. 20433
USA
and regional development banks, such as
African Development Bank
01 P.O. Box 1387
Abidjan
Ivory Coast
Canada
Canadian International Development
Authority (CIDA)
Place du Centre
200 Promenade du Portage
Hull, Quebec, K1A 0G4
Denmark
Ministry of Foreign Affairs
Q. Asiatisk
TLADS
DK 1448 Copenhagen
Germany
Ministry of Economic Cooperation
and Development
Friedrich-Ebert-Allee 114-116
D- 53113 Bonn
Germany
Italy
Department of Development Cooperation
Ministry of Foreign Affairs
I-00100 Rom
Norway
Nutritional Consultant
c/o HEFA
Royal Norwegian Ministry of Development
Cooperation
P.O. Box 8142
N-033 Oslo 1
Sweden
Swedish International Development
Agency (SIDA)
Birger Jarlsgatan 61
S-10525 Stockholm
The Netherlands
Coordinator of Food and Nutrition
Ministry of Foreign Affairs
Bureau DST/Pl( a)
P.O. Box 20061
NL-2500 EB Den Haag
United Kingdom
The Secretary
Overseas Development Association
(ODA)
1 Stag Place
London SW1 5DH
England
United States of America
Director of Nutrition
Agency of International Development
(USAID)
Department of State
23 and C Street, N.W.
Washington, D.C. 20001
AMREF
P.O. Box 30125
Nairobi
Kenya
Médecins
Sans Frontières France
Départment Médical
8, rue Saint-Sabin
F-7544 Paris Cedex 11
France
OXFAM
Medical Unit
274 Banbury Road
Oxford OX2 70Z
England
Save
the Children
54 Wilton Road
Westport, CT 06880
USA
6.10
WHO global database on child growth
Description:
Growth assessment is the best single measure for defining the health and nutritional status of children, while serving as an indirect indicator of the quality of life of entire populations. The goal of reducing, by the year 2000, severe and moderate protein-energy malnutrition in children under five years of age by half of 1990 prevalence levels has been endorsed in numerous international forums. The WHO Global Database on Child Growth, which is a standardized compilation of anthropometric data from population-based nutritional surveys conducted around the world from 1960 onwards, permits monitoring progress towards achieving this goal. The aim is to describe the worldwide distribution of child growth failure, to provide an accurate picture of child growth as a basis for intercountry and interregional comparisons, and to facilitate monitoring of national, regional and global trends. The standardized presentation of data by country in the database includes: a) systematic use of the NCHS/WHO international reference population, b) display of growth retardation prevalences for preschool children, as measured by the proportion of weight-for-age (underweight), height-for-age (stunting) and weight-for-height (wasting) below -2 (moderate) and -3 (severe) standard deviations (SD) from the median of the reference population, c) display of the prevalence of overweight, as measured by the proportion of children with weight-for-height above +2 SD, d) display of Z-score means and SD for the three indices, and e) stratification of the results according to age, sex, region, and rural/urban. This detailed account of data on child malnutrition will be relevant to national authorities in planning and evaluating nutrition interventions; it will also serve as a baseline for child nutritional status worldwide for all who are concerned with protecting and promoting optimal child growth. It is hoped that continual updating of the database will stimulate the gathering and sharing of new information, particularly in those countries and regions thus far scarcely investigated. At present the database covers over 80% of the total population of under-5-year-olds worldwide.
Source:
WHO programme information derived from population-based nutritional surveys.
Notes on usage:
Queries are received via all forms of communication. Responses are dispatched as print-outs of the relevant country data/references. Dissemination via WHO/LAN is being implemented.
Responsible Unit:
Please address any comments or suggestions concerning the contents to:
Nutrition Unit
WHO Telephone: (+41 22) 791 3320
20 Avenue Appia Fax: (+41 22) 791
0746
CH-1211 Geneva 27 E-mail: bloessnerm@who.ch
Switzerland deonism@who.ch
Download
File (Winword 6.0 Format)
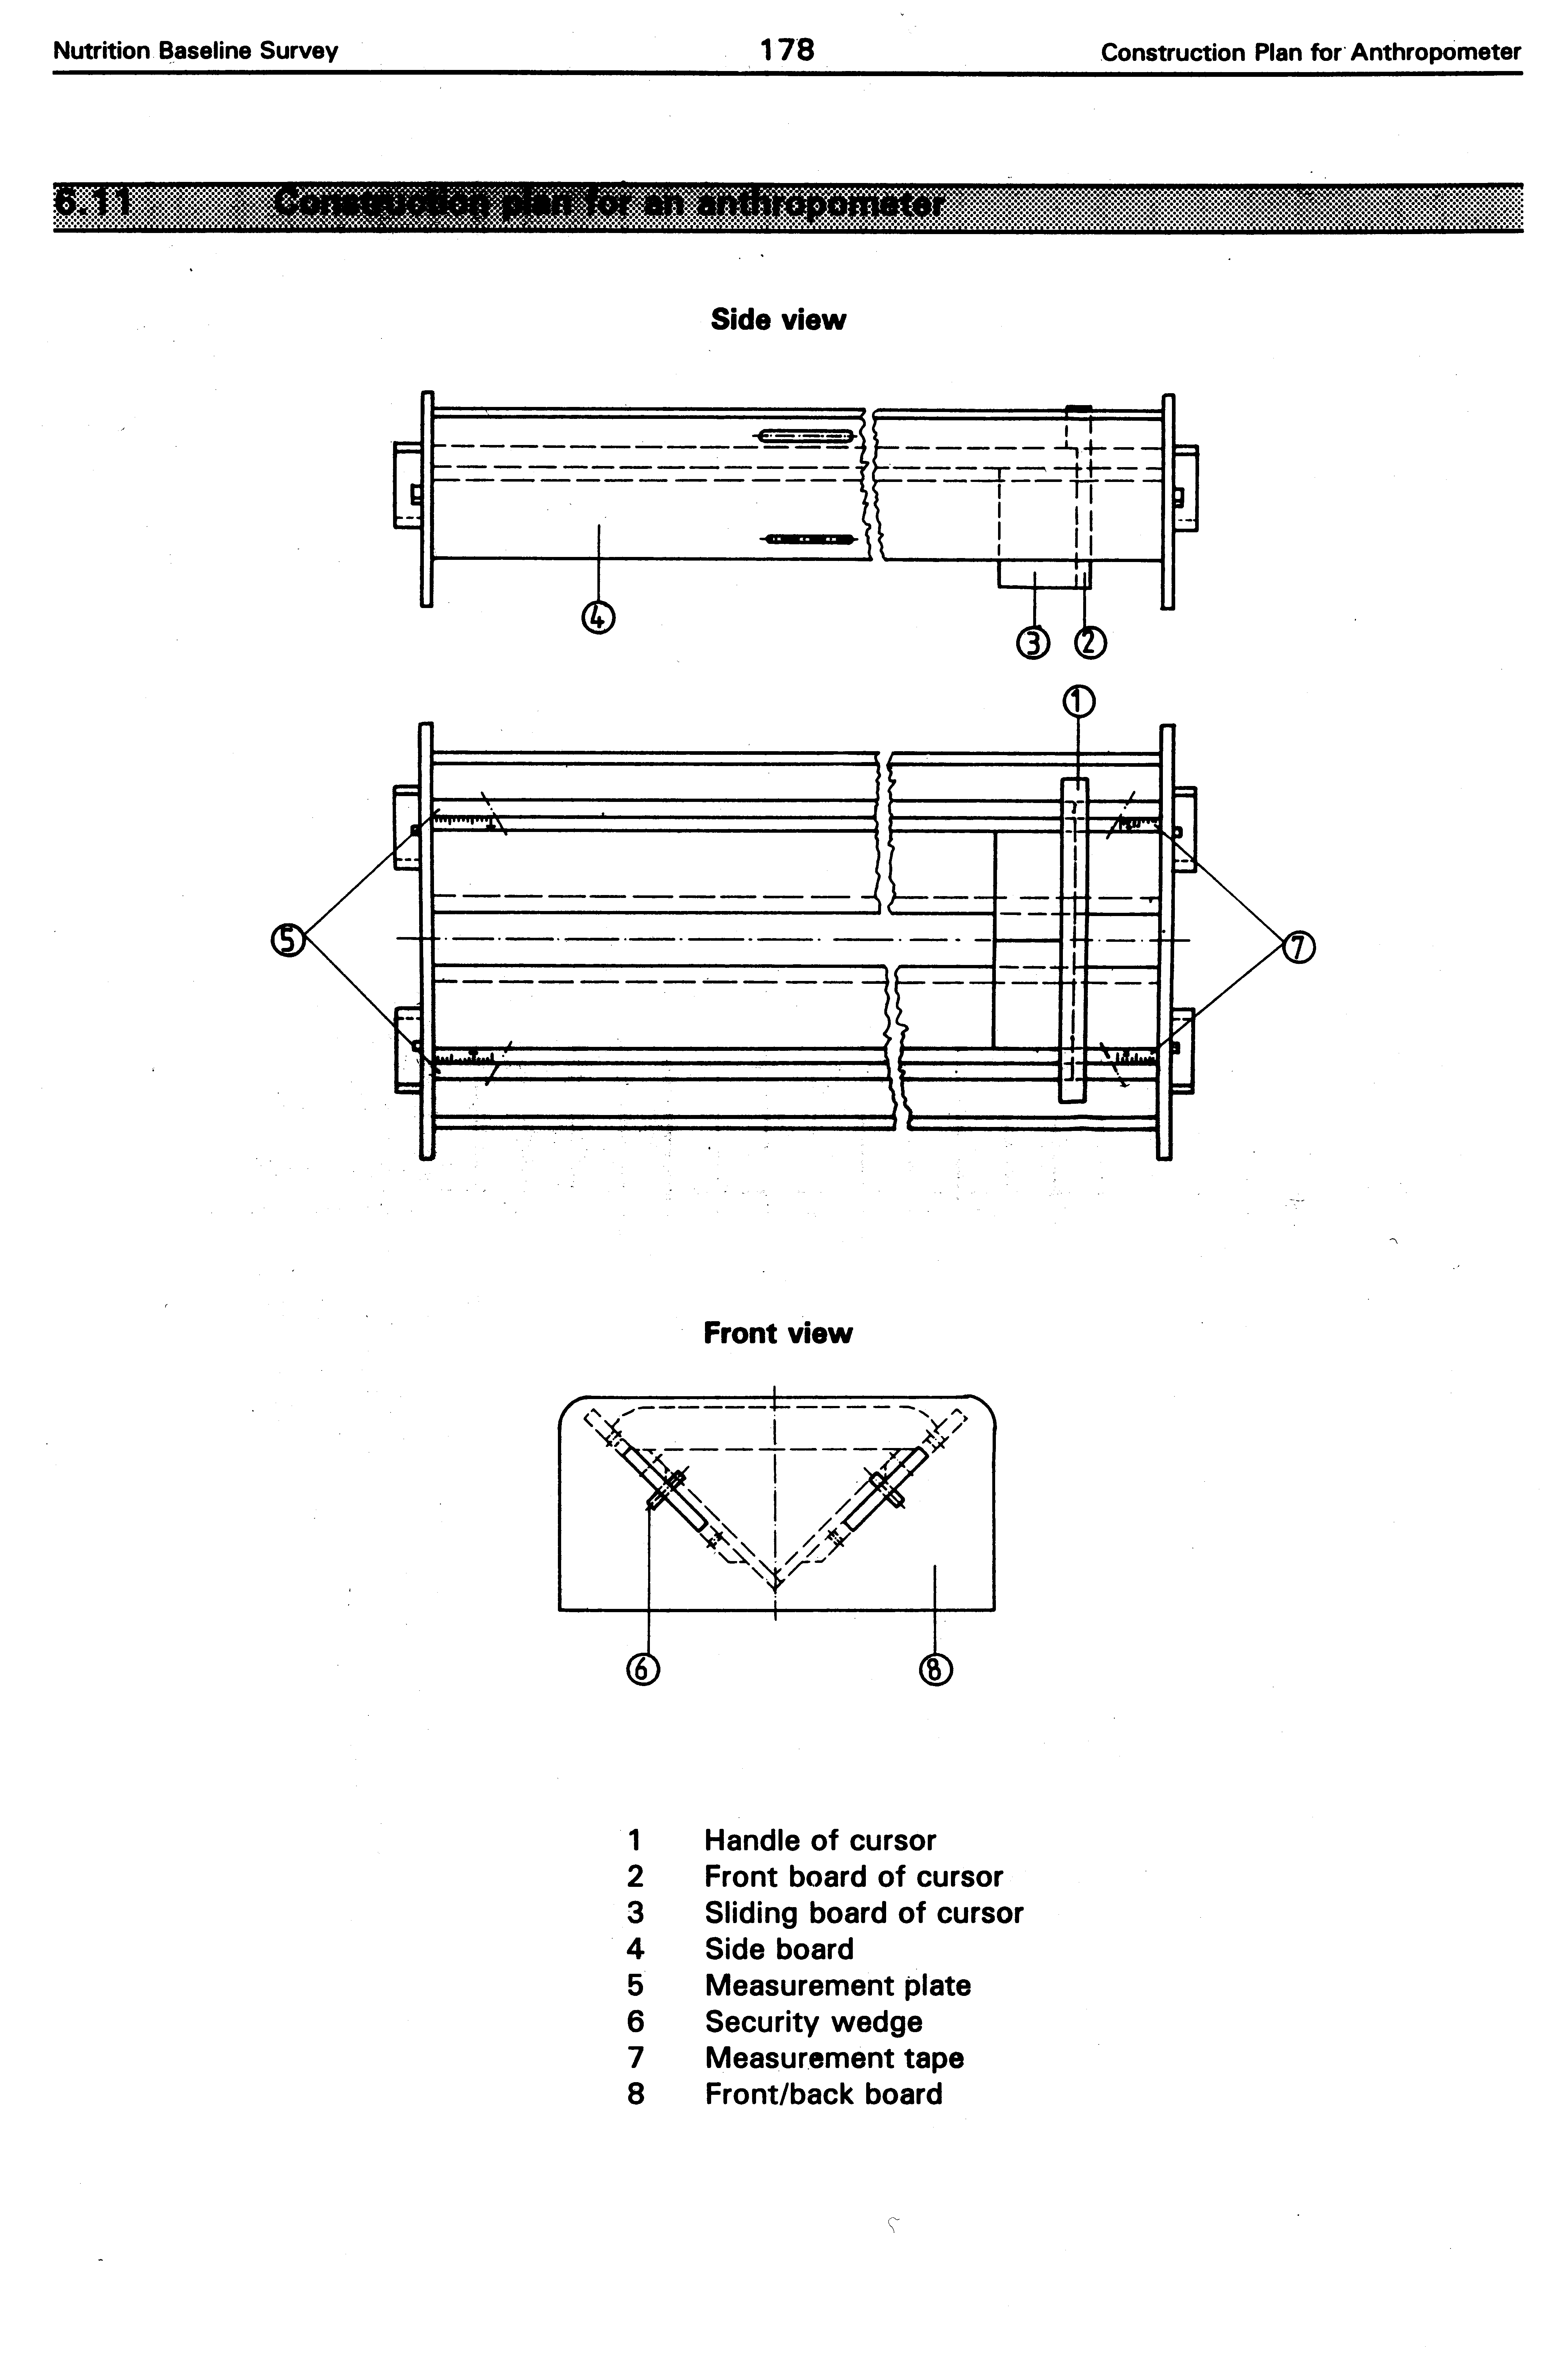
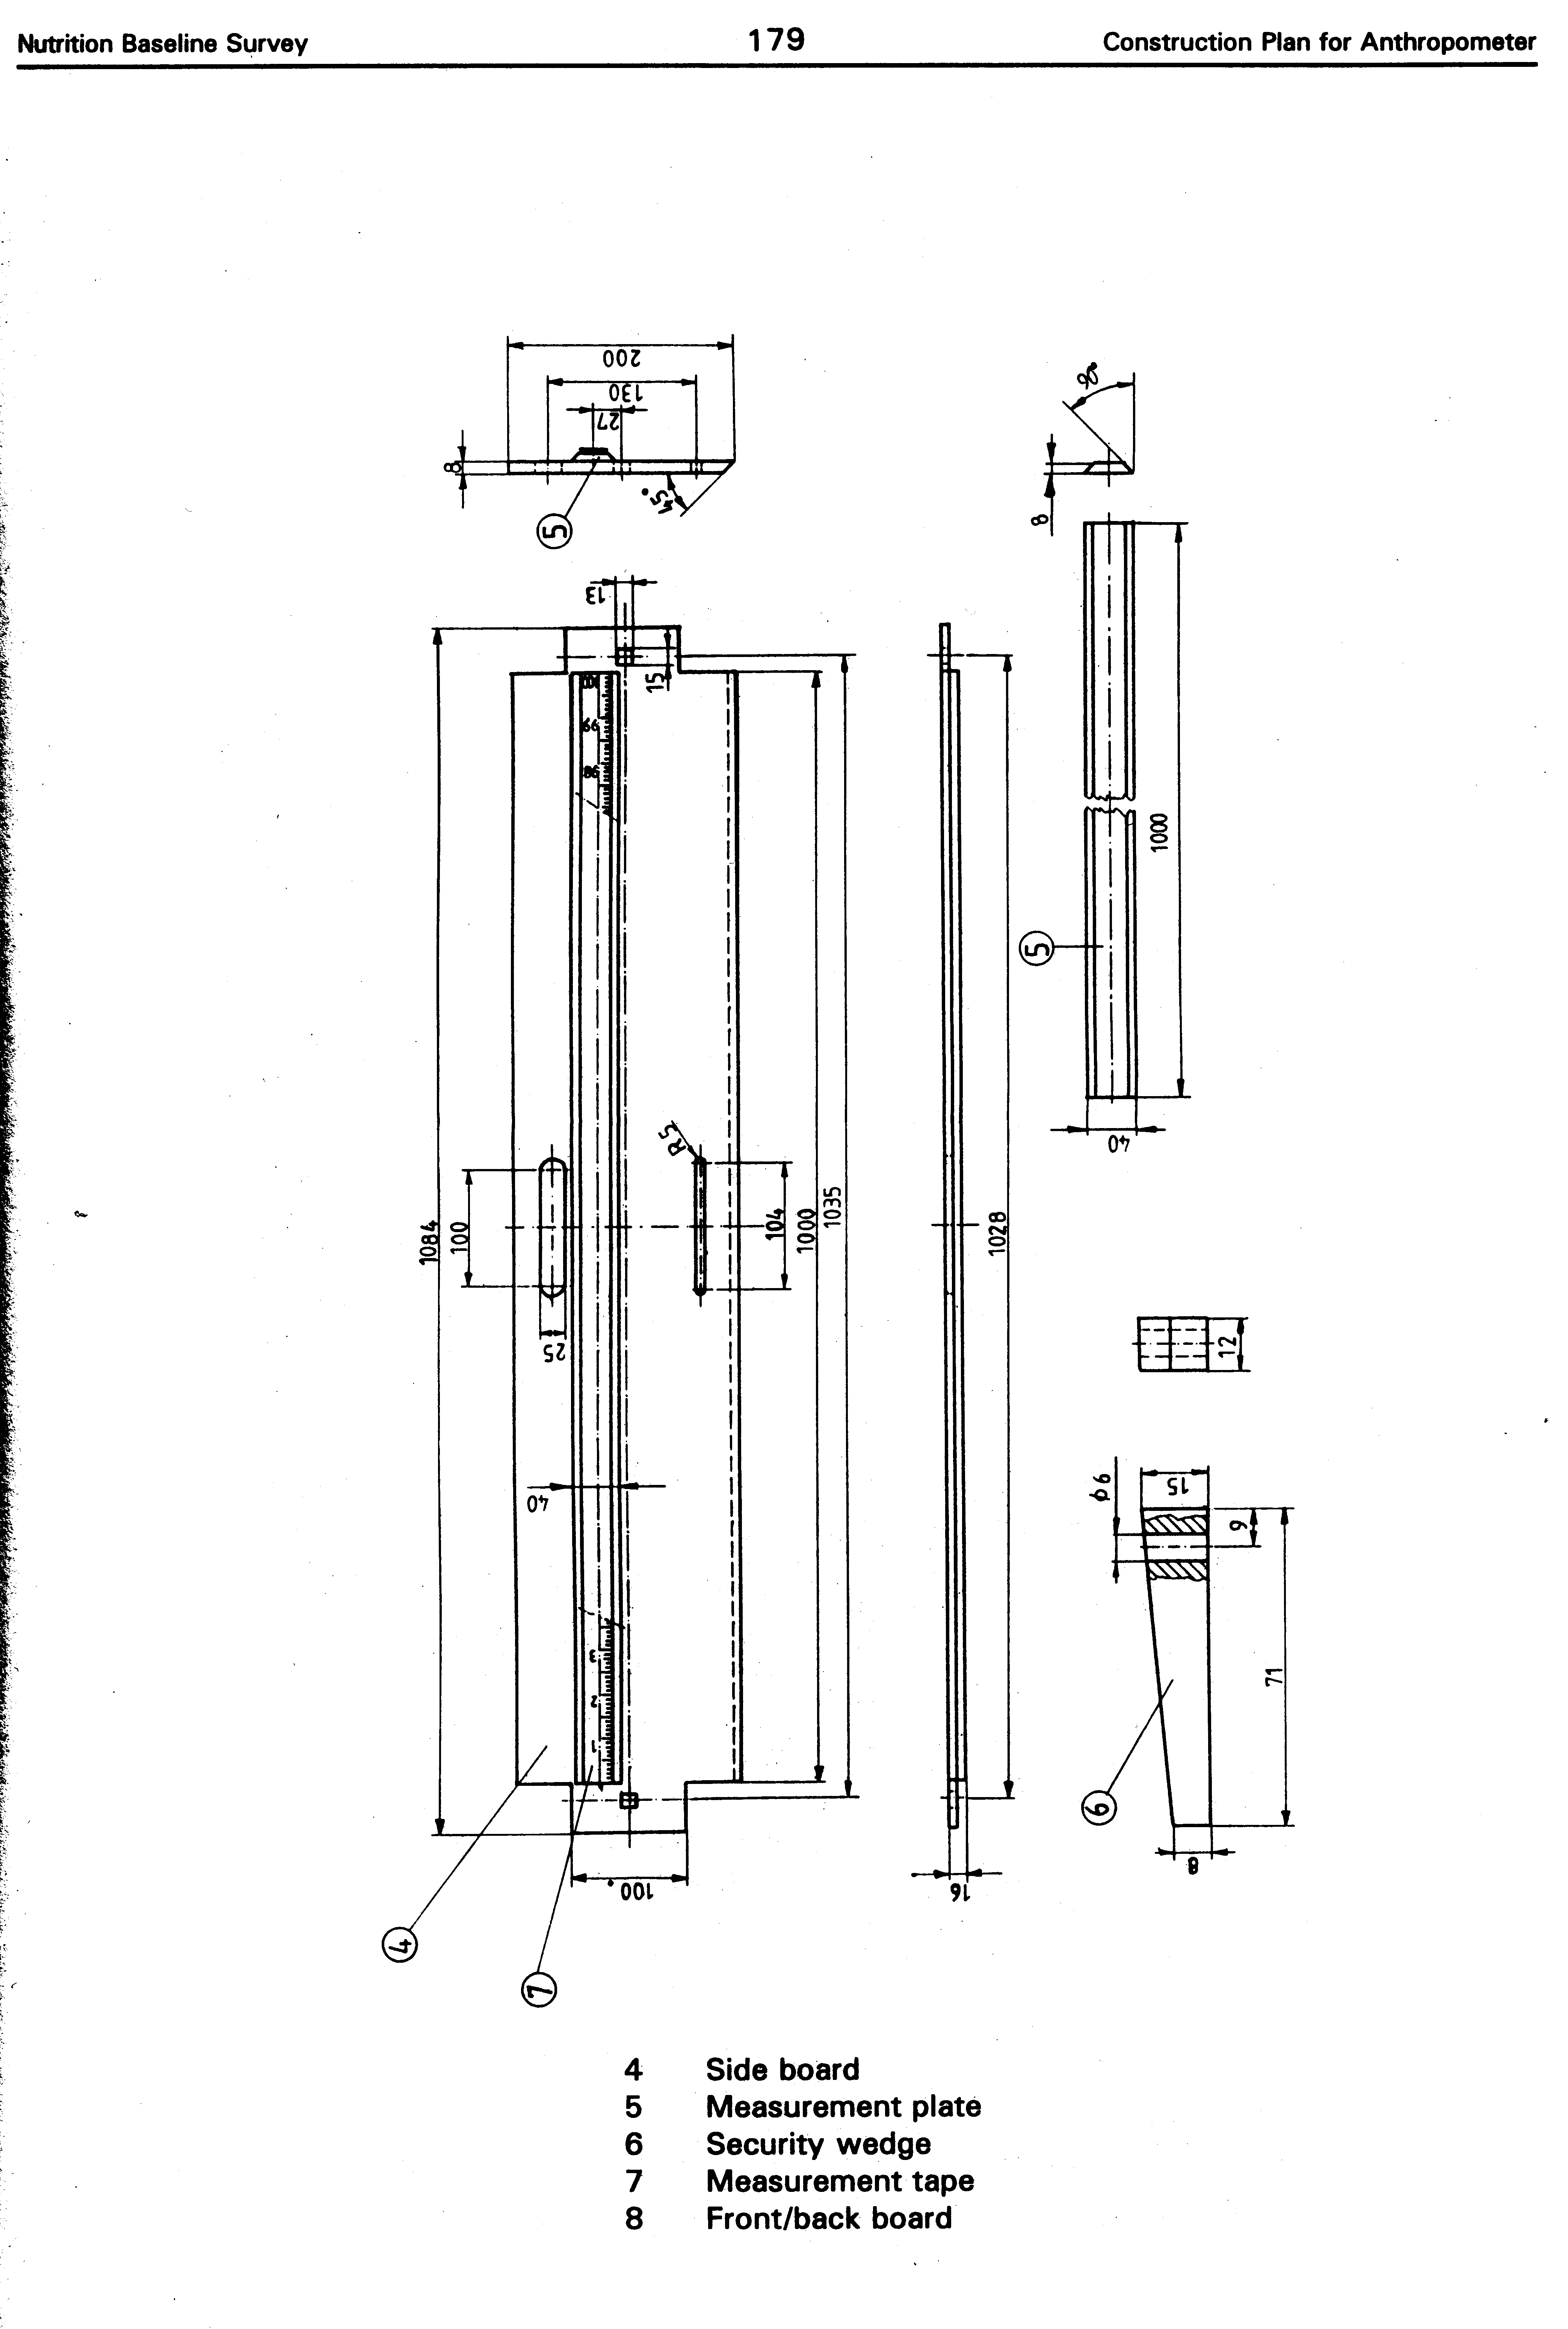
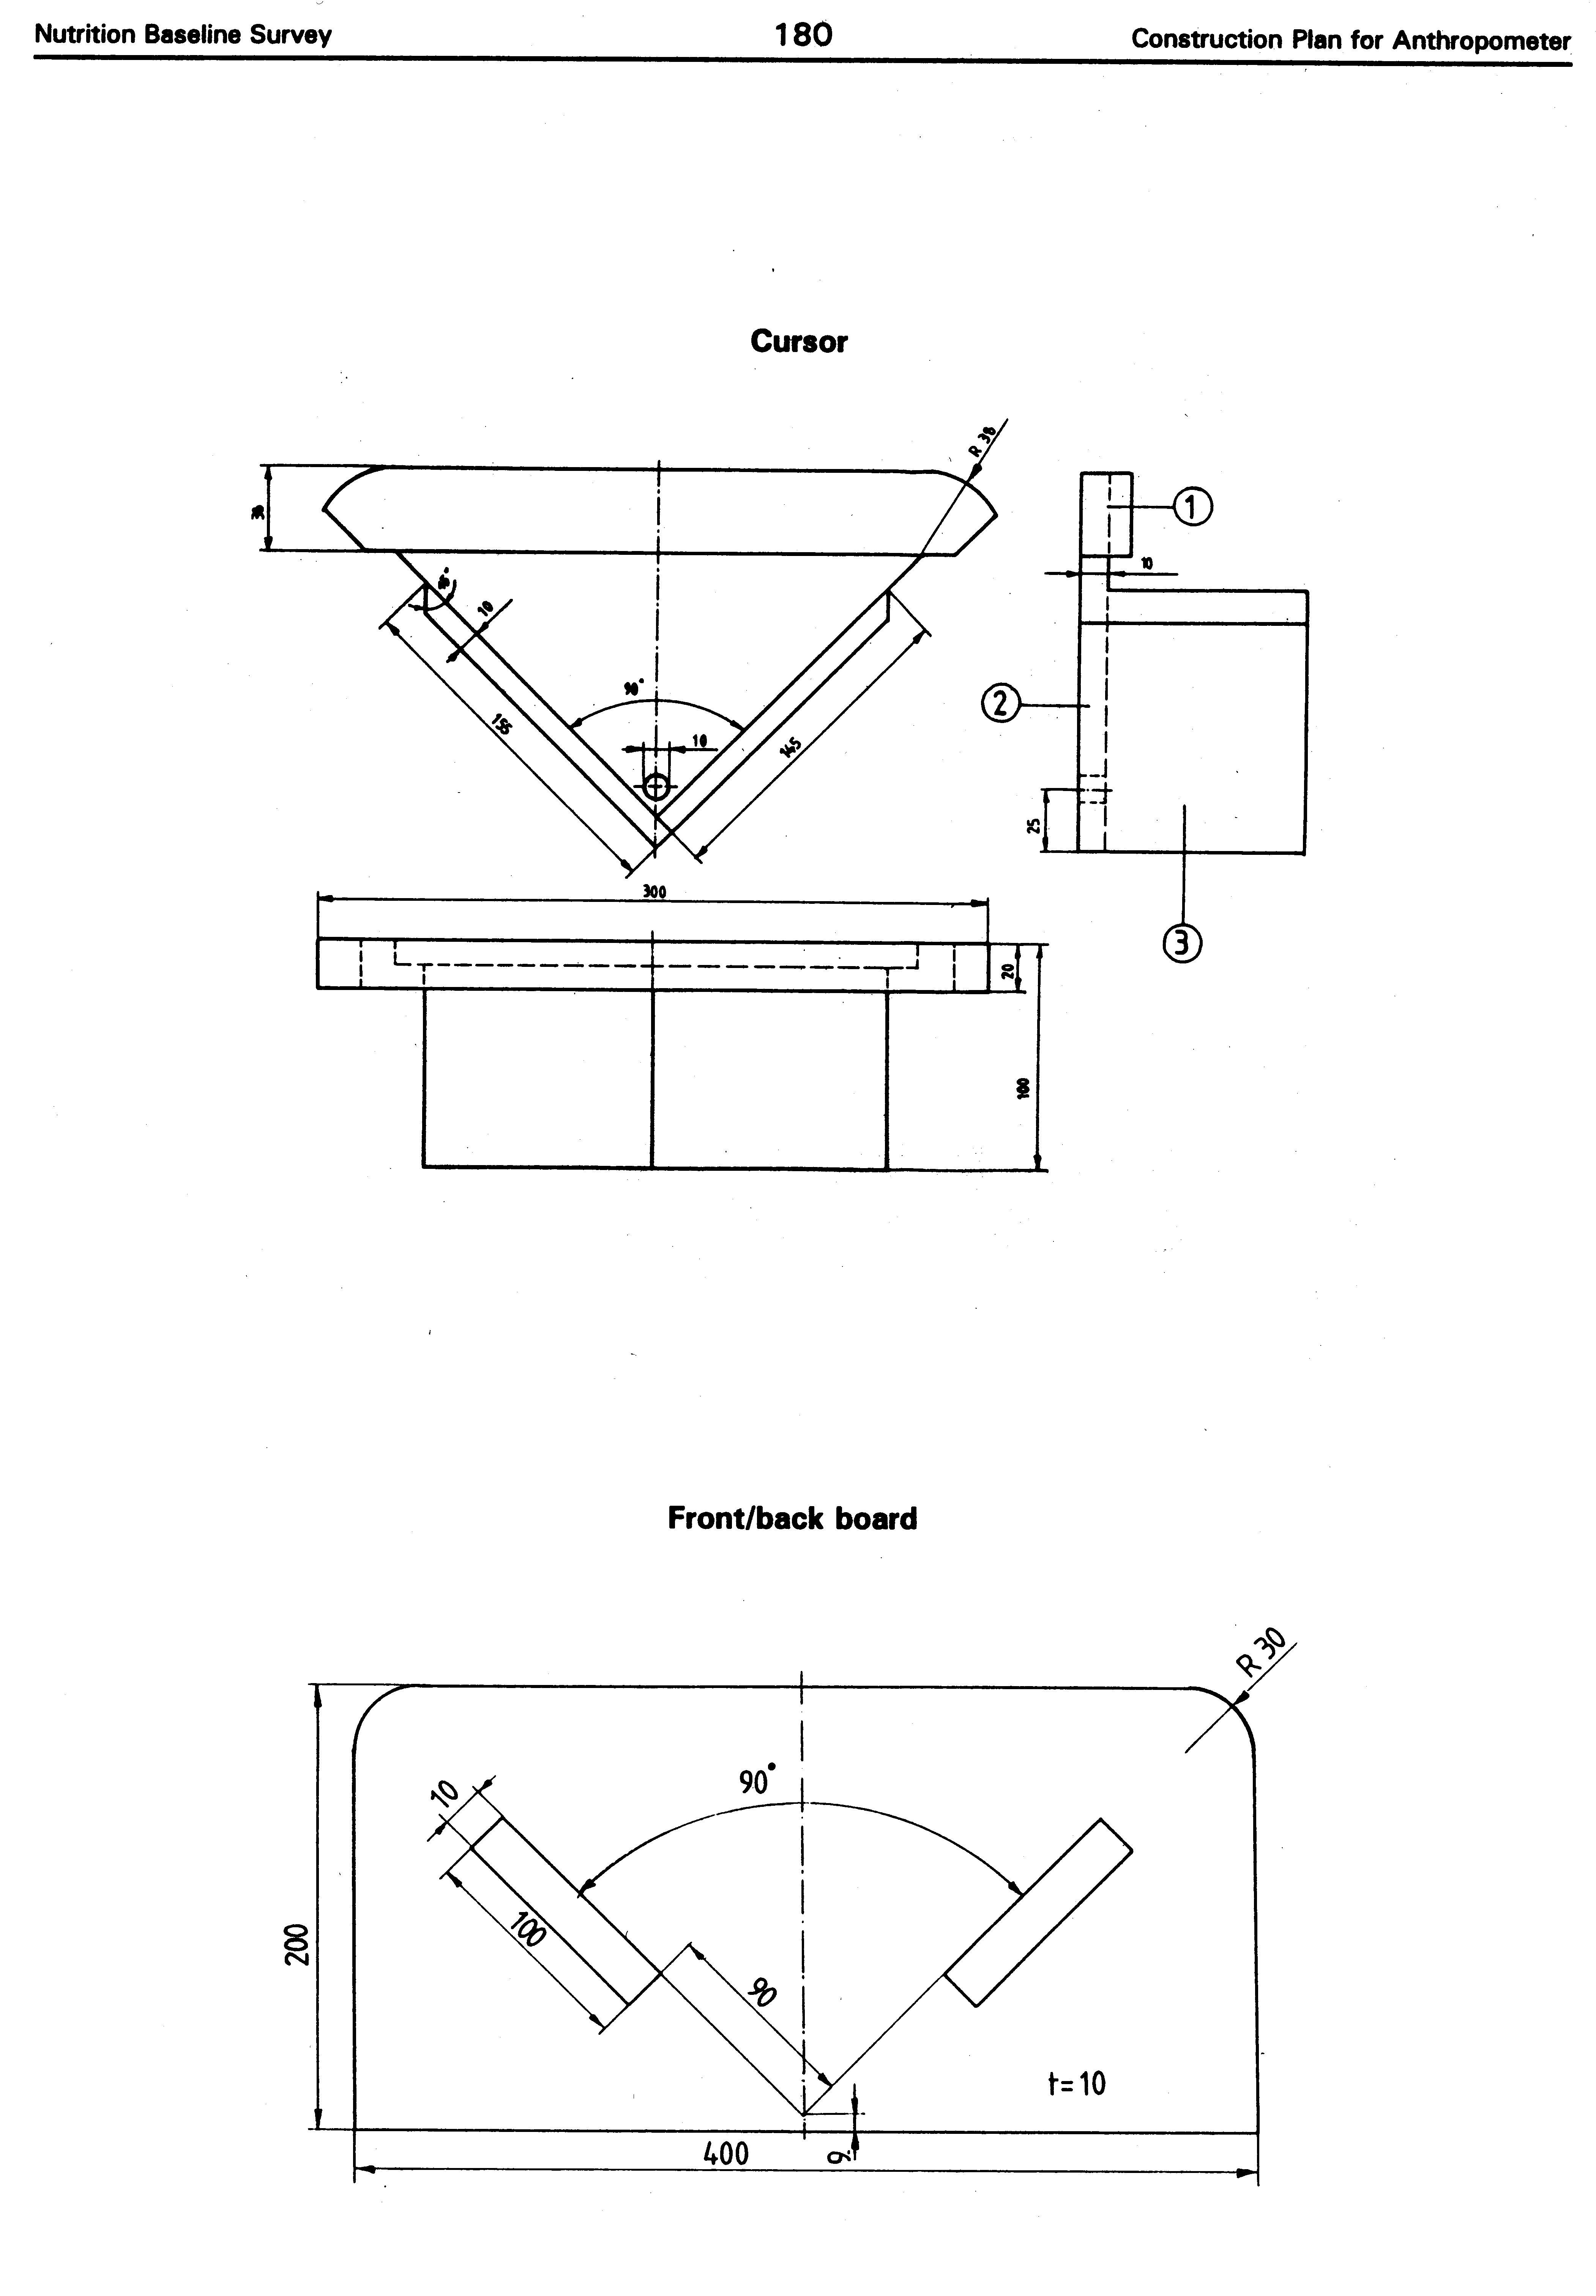
6.11 Construction plan for an anthropometer
6.12
Literature for further study
Beaton G, Kelly A, Kevany J, Martorell R, & Mason J. Appropriate uses of child anthropometry. ACC/SCN (SOA No.7). Geneva, Switzerland, 1990.
Beghin I, Cap M, & Dujardin B. A guide to nutritional assessment. WHO. Geneva, Switzerland, 1988.
Bennet S, Woods T, Liyanange WM, & Smith DL. A simplified general method for cluster-sample surveys of health in developing countries. Rapp trimest statist sanit mond 1991; 44:98-106.
Cameron N. The measurement of human growth. Croom Helm Ltd., Provident House, Burrell Row, Beckenham, Kent, UK, 1984.
Center for Disease Control and Health Service Administration. Weighing and measuring children: a training manual for supervisory personnel. Center for Disease Control, Atlanta, Georgia, USA, 1980.
Council for International Organizations of Medical Sciences (CIOMS). International guidelines for ethical review of epidemiological studies. Geneva, Switzerland, 1991.
Fink A & Kosecoff J. How to conduct surveys. Step-by-step guide. Ninth printing. Sage Publications. Newbury Park, London, UK; New Delhi, India, 1991.
FAO. Conducting small-scale nutrition surveys. A field manual. Nutrition in Agriculture No. 5. Food and Agriultural Organization of the United Nations. Rome, 1990.
Fowler FJ. Survey research methods. Saga Publications. New York, USA, 1984.
Gibson RS. Principles of nutritional assessment. Oxford University Press. Oxford, New York, Tokyo, 1990.
den Hartog AP & van Staveren WA. Manual for social surveys on food habits and consumption in developing countries. Pudoc. Wageningen, The Netherlands, 1983.
Hendrata L & Johnston M. Manual for community based under-fives weighing programme. Yayasan Indonesia Sejahtera, Jakarta, Indonesia, 1978.
Jelliffe DB. Paediatrics in the tropics. Teaching Aids at Low Costs. TALC. St. Albans, UK, 1985.
Jelliffe DB. The assessment of nutritional status of the community. WHO. Geneva, Switzerland, 1966.
Jelliffe DB. Community nutritional assessment. Oxford University Press. Oxford, New York, Tokyo, 1989.
Jennings J, Gillespie S, Mason J, Lofti M, & Scialfa T. Managing successful nutrition programmes. ACC/SCN (SOA No.8). Geneva, Switzerland, 1991.
Katz J. Sample-size implications for population-based cluster surveys of nutritional status. Am J Clin Nutr. 1995; 61:155-160.
Kirkwood BR. Essentials of medical statistics. Blackwell Scientific Publications. Oxford, London, Edinburgh, UK, 1988.
List B. Ernährungsaspekte in der ländlichen Entwicklung. 2. Auflage, DSE & GTZ. Feldafing, Eschborn, Germany, 1988.
Lohmann TG, Roche AF, & Martorell R. Anthropometric standardization reference manual. Abridged edition. Human Kinetics Books. Campaign, Illinois, USA, 988.
Lwanga SK & Lemeshow S. Sample size determination in health studies - a practical manual. WHO. Geneva, Switzerland, 1991.
Martorell R. Nutrition and health status indicators. LSMS Working Paper Series No. 13, The World Bank. Washington, USA, 1982.
Médecins Sans Frontières. Nutrition Guidelines. 1st edition. Paris, 1995
Morley D & Woodland M. See how they grow: monitoring child growth for appropriate health care in developing countries. Oxford University Press. Oxford, New York, Tokyo, 1979.
Sahn DE, Lockwood R, & Scrimshaw NS. Methods for the evaluation of the impact of food and nutrition programmes. The United Nations University. Tokyo, Japan, 1984.
Scrimshaw S and Hutardo. Rapid Assessment Procedures for Nutrition and Primary Health Care. The United Nations University. Tokyo, Japan, 1987.
Sichert W, Oltersdorf U, Winzen U, & Leitzmann C. Ernährungs-Erhebungs-Methoden. Schriftenreihe der Ernährungsverhalten e.V., Band 4, Beiheft der Zeitschrift Ernährungs-Umschau, Umschau-Verlag. Frankfurt am Main, Germany, 1984.
Mith PG & Morrow RH. Methods for field trials of Interventions against tropical diseases: a 'toolbox.' Oxford University Press. Oxford, New York, Tokyo, 1993.
Tinibu A. Weight charting and its significance in child health. University of North Carolina, African Health Schooling Institutions Project. Chapel Hill, USA, 1978.
United Nations. How to weigh and measure children. National Household Survey Capability Programme. New York, USA, 1986.
Vaughan JP & Morrow RH. Manual of epidemiology for district health management. WHO. Geneva, Switzerland, 1989.
Werner D. Helping health workers learn: a book of methods, aids and ideas for instructions at the village level. Hesperian Foundation. Palo Alto, USA, 1982.
World Health Organization. Growth charts and home based child's records in maternal and child health care. An appropriate approach and reference manual for their evaluation. Geneva, Switzerland, 1978.
World Health Organization. Guidelines for training community health workers in nutrition. Publication No. 59, 2. edition. Geneva, Switzerland, 1986.
World Health Organization. Measuring change in nutritional status. Geneva, Switzerland, 1983.
World Health Organization. Training modules for household surveys on health and nutrition. Geneva, Switzerland, 1988.
World Health Organization. Indicators for assessing breast-feeding practices. WHO/CDD/SER/91.14. Geneva, Switzerland, 1991.
World Health Organization. Physical
status: the use and interpretation of anthropometry. Report of a WHO Expert
Committee. WHO Technical Report Series 854. Geneva, Switzerland, 1995.